
Micronutrient Fertilizer Application to Increase Pea Yield and Improve Nutritional Quality

by Yesuf Assen Mohammed and Chengci Chen
Eastern Agricultural Research Center, Sidney, MT
INTRODUCTION
Micronutrients are essential elements for plant growth but are required in small amounts. Boron (B), chloride (Cl), copper (Cu), iron (Fe), manganese (Mn), molybdenum (Mo), nickel (Ni), and zinc (Zn) are required to complete the life cycle of plant growth. The bio-availability of these nutrients in the soil for plant uptake is affected by several factors. Continuous cropping of high yielding cultivars without micronutrient fertilization can cause nutrient mining, and phosphorus (P) fertilizer can induce metal micronutrient deficiency due to chemical fixation. Advances in fertilizer production technology have reduced impurities including micronutrients. Micronutrient deficiency in the soil not only reduces yield but also lowers the micronutrient concentration in the edible crops. This can cause mineral deficiency in the diet resulting in several diseases such as iron deficiency anemia. Agronomic bio-fortification involves increasing micronutrient availability for plant uptake to enhance micronutrient density in the edible part of the crop and to increase yields. This bio-fortification strategy has been proposed as a solution to global micronutrient nutrition (Thavarajah and Thavarajah 2012). Dry pea (Pisum sativum L.) is an important crop in Montana with several agronomic, economic and health benefits, yet micronutrient fertilization effects on yield and quality of dry pea is lacking for Montana. This information is essential since the dry pea production area is growing in the state. The objective of this study was to determine the effects of B, Cu, Fe, Mn, Mo and Zn foliar application rates on grain yield and nutritional quality of dry pea.
METHODS
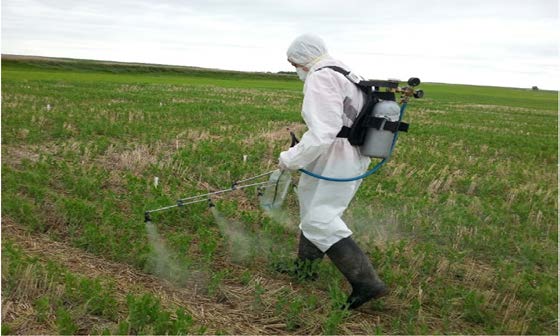
Figure 1. Foliar micronutrient applicaiton. Photo courtesy Y. Mohammed.
The experiment was conducted at Sidney (Eastern Ag Research Center) and Richland (cooperator farm) in the 2016 and 2017 crop seasons. Composite soil samples were collected at planting time and tested for various soil properties. The dry pea (cultivar Montech 4152) was seeded at 8 live seeds/ft2. The design was a randomized complete block with four replications and plot size of 6 x 20 ft. The treatments included application of B, Cu, Mo and Zn at 0.5, 1.0 and 1.5 lb/ac; while, Fe and Mn were applied at 1.0, 2.0, and 3.0 lb/ac. The control treatment was water that was used to mix and spray the micronutrients. The liquid fertilizer sources were sodium borate, copper sulfate, iron sulfate, manganese sulfate, sodium molybdate and zinc sulfate for B, Cu, Fe, Mn, Mo and Zn, respectively. The micronutrients were foliar applied using a backpack sprayer early- to mid-June when there were enough leaves to catch the spray (Figure 1). Grain yield was adjusted to 13% moisture content before statistical analysis.
RESULTS
Soil properties
The two-year mean soil test values at Richland were: pH 6.9, 3.1% organic matter, 20 lb/ac nitrate-N, 12 ppm Olsen P and 16% clay in the top 0-6 inch soil depth. Similarly, the soil test results at Sidney were: pH 7.7, 2.8% organic matter, 55 lb/ac nitrate-N, 29 ppm Olsen P and 24% clay. The soil test results differed by site and year for some of the soil micronutrients (Table 1). At Sidney, the Fe content increased substantially from 2016 to 2017. The seasonal variations in drying and wetting of the soil could affect Fe chemistry and thus its bio-availability, indicating the importance of soil testing every season. Iron, Cu, Mn and Zn concentration at both locations were above or close to the critical values (the value above which a yield response to nutrient application is highly unlikely), whereas soil B and Mo concentrations were consistently less than the critical values. Therefore, micronutrient responses would be most expected for B and Mo application.
| Site | Boron | Copper | Iron | Manganese | Molybdenum | Zinc | ||||||
|---|---|---|---|---|---|---|---|---|---|---|---|---|
| Year | 2016 | 2017 | 2016 | 2017 | 2016 | 2017 | 2016 | 2017 | 2016 | 2017 | 2016 | 2017 |
| Richland | 0.4 | 0.6 | 0.4 | 0.5 | 22 | 28 | 22 | 10 | <1 | <1 | 0.5 | 0.7 |
| Sidney | 0.6 | 0.4 | 0.6 | 1.1 | 7 | 32 | 6 | 13 | <1 | <1 | 0.4 | 0.5 |
| Critial value† | 1 | 0.5 | 5 | 1 | 5 | 0.5 | ||||||
|
†Critical value to maximize yield Sources: Jacobson et al. (2005) for B, Cu, Fe, Mn, and Zn; and the International Plant Nutrition Institute (http://anz.ipni.net) for Mo. Boron was determined following hot water extraction method and the other micronutrients were determined following diethylenetriaminepentaacetic acid (DTPA) extraction method. |
||||||||||||
Grain yield
In 2016, fertilization with each micronutrient increased grain yield at Richland. This grain yield increase over the control ranged from 479 lb/ac (at 2.0 lb Fe/ac) to 1079 lb/ac (at 1.0 lb Cu/ac; Figure 2), even though some micronutrient soil test results were above critical values. For instance, application of 1.0 lb Mn/ac resulted in a significant yield increase (993 lb/ac) over the control at Richland. The response at Sidney was significant only to B and Mo. Specifically, application of 1.0 lb B /ac increased yield by 334 lb/ac over the control and application of 0.5 lb Mo/ac improved the yield by 604 lb/ac. In 2017, the mean grain yield was considerably less than in 2016 mainly due to low growing season precipitation (April to August) in 2017. In 2017, Richland and Sidney only received 4.3 and 3.9 inches growing season precipitation, respectively, compared to 11.0 and 9.7 inches, respectively, in 2016. Despite the 2017 drought, grain yields increased with Cu, Fe, Mn, Mo and Zn application at Richland, to the extent of 632 lb/ac with 1.5 lb/ac Mo application over the control (Figure 3). Yields did not respond to any micronutrient application at Sidney in 2017. Sidney was warmer and drier than Richland both years. The low moisture and high temperature (particularly temperature greater than 80 oF at time of flowering) at Sidney could be some of the reasons for the lack of yield responses to most of the micronutrient fertilizer applications at Sidney and lower grain yields at this location than at Richland.
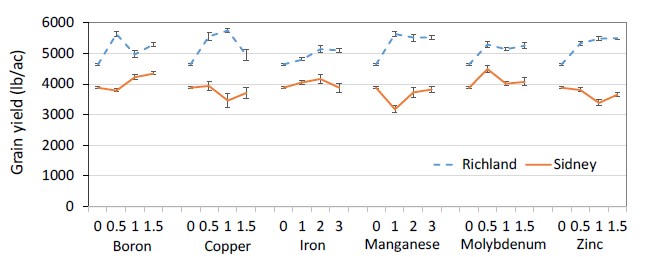
Figure 2. The effect of micronutrient fertilizer application rates (lb/ac) on the grain yield of dry pea in 2016 at Richland and Sidney, Montana.
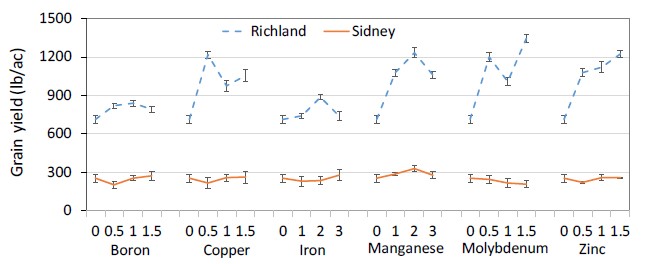
Figure 3. The effect of micronutrient fertilizer application rates (lb/ac) on the grain yield of dry pea in 2017 at Richland and Sidney, Montana.
Grain iron and zinc concentration
Grain Fe and Zn concentrations were affected by application of Fe and Zn. In 2016, only application of Fe at Sidney and Zn at Richland increased grain micronutrient content. Grain Fe content increased with increasing Fe application rate at Sidney. Specifically, application of 3 lb Fe/ac at Sidney enriched grain Fe content by 19% (an increase from 41.7 to 49.7 ppm) compared with the control (Figure 4A). According to the National Institute of Health (NIH), women (age 19 to 50 yr) require 18 mg Fe/day (NIH, 2016). Although it is unlikely an adult woman can get her total suggested daily requirement of Fe from pea, this 19% bio-fortification of grain should help combat malnutrition. In 2016, the soil Fe content at Sidney was much lower than in the other three site years, which might explain why Sidney in 2016 had the only Fe content response to Fe application. Fertilization with 1.5 lb Zn/ac at Richland increased the grain Zn concentration from 22.7 ppm (control) to 24.1 ppm (Figure 4B). Micronutrient application did not increase grain nutrient content in 2017 (Figure 5A and 5B). The grain concentrations of Fe and Zn were consistently higher at Sidney than Richland possibly due to a dilution effect (high nutrient concentration in the grain due to low grain yield). The 2016 results indicated that micronutrient application can increase dry pea grain micronutrient contents. This agronomic bio-fortification can combat global micronutrient deficiency caused diseases and might be rewarded in higher prices at some point.
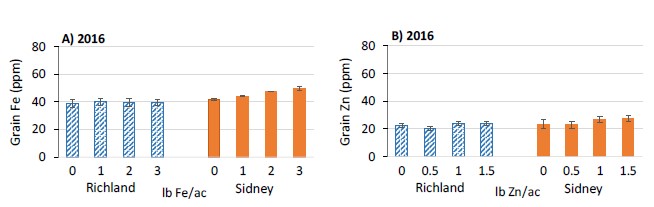
Figure 4. The effect of foliar application of Fe and Zn on dry pea grain Fe (A) and Zn (B) content in 2016 at Richland and Sidney, Montana. Error bars are standard error of the mean (n=4).
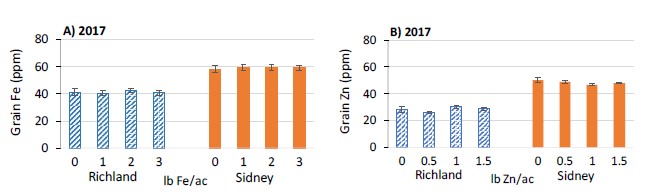
Figure 5. The effect of foliar application of Fe and Zn on dry pea grain Fe (A) and Zn (B) content in 2017 at Richland and Sidney, Montana. Error bars are standard error of the mean (n=4).
FERTILIZER FACTS
- Micronutrient application increased dry pea grain yield at the high yielding Richland site, but only B and Mo application resulted in a significant yield increase in one of the two years at Sidney, when there was no drought. When there was a yield response, the lowest amount of micronutrient application rates appeared to provide benefits at both locations.
- Soil B and Mo levels were below critical levels and responses to both were seen in 3 of 4 site-years.
- Micronutrient application with soil test results above critical values (e.g., Fe and Mn at Richland) resulted in yield responses, suggesting that critical levels should not be the sole decision-making factor for micronutrient fertilization (e.g., high yielding years and sites, and/or previous micronutrient responses).
- Agronomic bio-fortification of dry pea enriched the grain with Fe and Zn. This can contribute to combating global malnutrition.
ACKNOWLEDGMENTS
This project was funded partly by the Montana Agricultural Experiment Station, Montana Fertilizer Advisory Committee, and USA Dry Pea and Lentil Council. We thank AGROLIQUID (St. Johns, MI) for providing micronutrient fertilizers and Richard Fulton (Richland, MT) for allowing us to conduct this research on his farm.
REFERENCES
Jacobsen, J., G. Jackson, and C. Jones. 2005. Fertilizer Guidelines for Montana Crops. MSU Extension Bulletin EB0161. http://landresources.montana.edu/soilfertility/documents/PDF/pub/FertGuidelMTCropsEB161.pdf
National Institute of Health. 2016. Iron: Dietary Supplement Fact Sheet. https://ods.od.nih.gov/factsheets/Iron-HealthProfessional
Thavarajah, D., and P. Thavarajah. 2012. Evaluation of chickpea (Cicer arietinum L.) micronutrient composition: Biofortification opportunities to combat global micronutrient malnutrition. Food Research International. 49:99-104. https://doi.org/10.1016/j.foodres.2012.08.007
Posted October 2020