
Nutrient Uptake & Removal
Understanding nutrient uptake timing and nutrient removal rates can help producers determine the correct timing of fertilizer applications for optimal growth and even to calculate fertilizer needs for their crops. The graphs below give nutrient uptake curves throughout the growing season for different crops and provide information on removal rates. Refer to Extension bulletins Fertilizer Guidelines for Montana Crops (EB0161) and Nutrient Uptake Timing (EB0191) for further information.
Each of the nutrient uptake curves on this page show nutrient uptake on the vertical axis and growth stage on the horizontal axis. In general, the curves show that the highest rate of uptake (steepest part of curve) occurs mid-season. Estimated amount of nutrients removed by harvest are also listed for most crops.
Jump to the following uptake graph:
- Small grain (wheat, barley, oat)
- Alfalfa
- Bean (dry)
- Canola
- Corn
- Grass, perennial pasture
- Lentil
- Pea
- Potato
- Sugar beet
- Sunflower
Small grain (wheat, barley, oat)
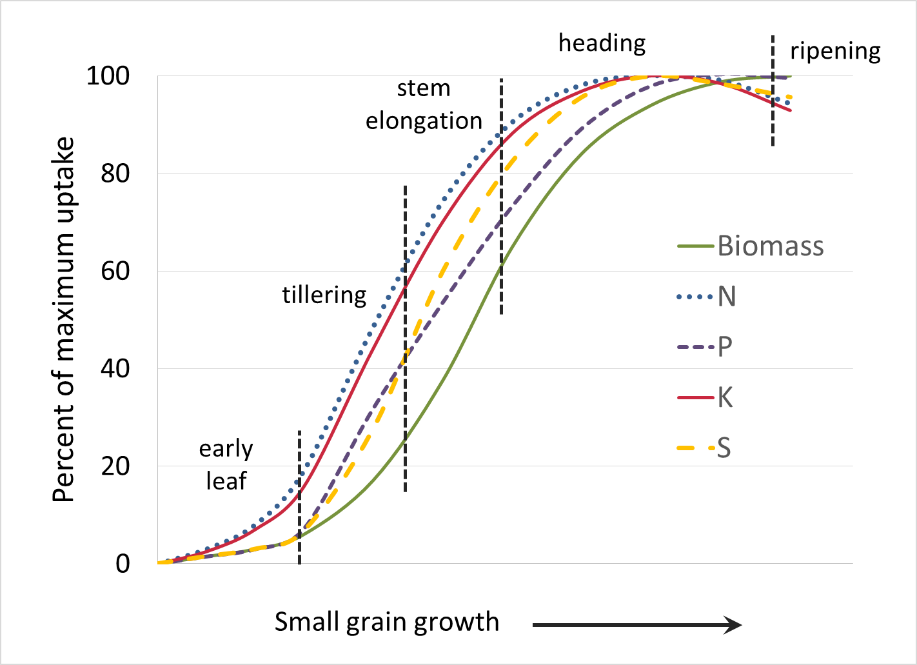
Source: Malhi, S.S., A.M. Johnston, J.J. Schoenau, Z.H. Wang, and C.L. Vera. 2006. Seasonal biomass accumulation and nutrient uptake of wheat, barley and oat on a Black Chernozem soil in Saskatchewan. Canadian Journal of Plant Science. 86: 1005–1014. DOI: 10.4141/P05-116
Estimated nutrient removal in harvested portion of crops (Fertilizer Guidelines for Montana Crops)
|
Crop
|
Unit
|
lb/bu
|
N
|
P2O5
|
K2O
|
Ca
|
Mg
|
S
|
Fe
|
Zn
|
Mn
|
Cu
|
B
|
|---|---|---|---|---|---|---|---|---|---|---|---|---|---|
|
— lbs —
|
|||||||||||||
|
Barley - grain
|
bu
|
48
|
0.87
|
0.36
|
0.25
|
0.025
|
0.05
|
0.08
|
-
|
0.0015
|
0.0008
|
0.0008
|
0.001
|
|
Barley - straw
|
ton
|
-
|
14
|
4.10
|
30
|
7.6
|
2.00
|
3.8
|
-
|
0.045
|
0.30
|
0.01
|
-
|
|
Oat - grain
|
bu
|
32
|
0.60
|
0.24
|
0.17
|
0.024
|
0.04
|
0.06
|
-
|
0.0006
|
0.001
|
0.0004
|
-
|
|
Oat - straw
|
ton
|
-
|
12.20
|
5.8
|
33
|
0.40
|
4.00
|
4.60
|
-
|
0.145
|
-
|
0.015
|
-
|
|
Wheat - grain
|
bu
|
60
|
1.25
|
0.62
|
0.38
|
0.025
|
0.15
|
0.08
|
-
|
0.0035
|
0.002
|
0.0008
|
0.001
|
|
Wheat - straw
|
ton
|
-
|
14.50
|
3.60
|
25
|
4.4
|
2.20
|
3.70
|
-
|
0.03
|
0.11
|
0.007
|
-
|
Alfalfa

Source: Pumphrey, F.V, and D.P. Moore, 1965. Sulfur and Nitrogen Content of Alfalfa Herbage During Growth. Agronomy Journal. 57:237-239.
Estimated nutrient removal in harvested alfalfa (Fertilizer Guidelines for Montana Crops)
|
Crop
|
Unit
|
N
|
P2O5
|
K2O
|
Ca
|
Mg
|
S
|
Fe
|
Zn
|
Mn
|
Cu
|
B
|
|---|---|---|---|---|---|---|---|---|---|---|---|---|
|
— lbs —
|
||||||||||||
|
Alfalfa
|
ton
|
48
|
11
|
53
|
28
|
5
|
5.5
|
0.38
|
0.11
|
0.11
|
0.02
|
0.02
|
Bean (dry)
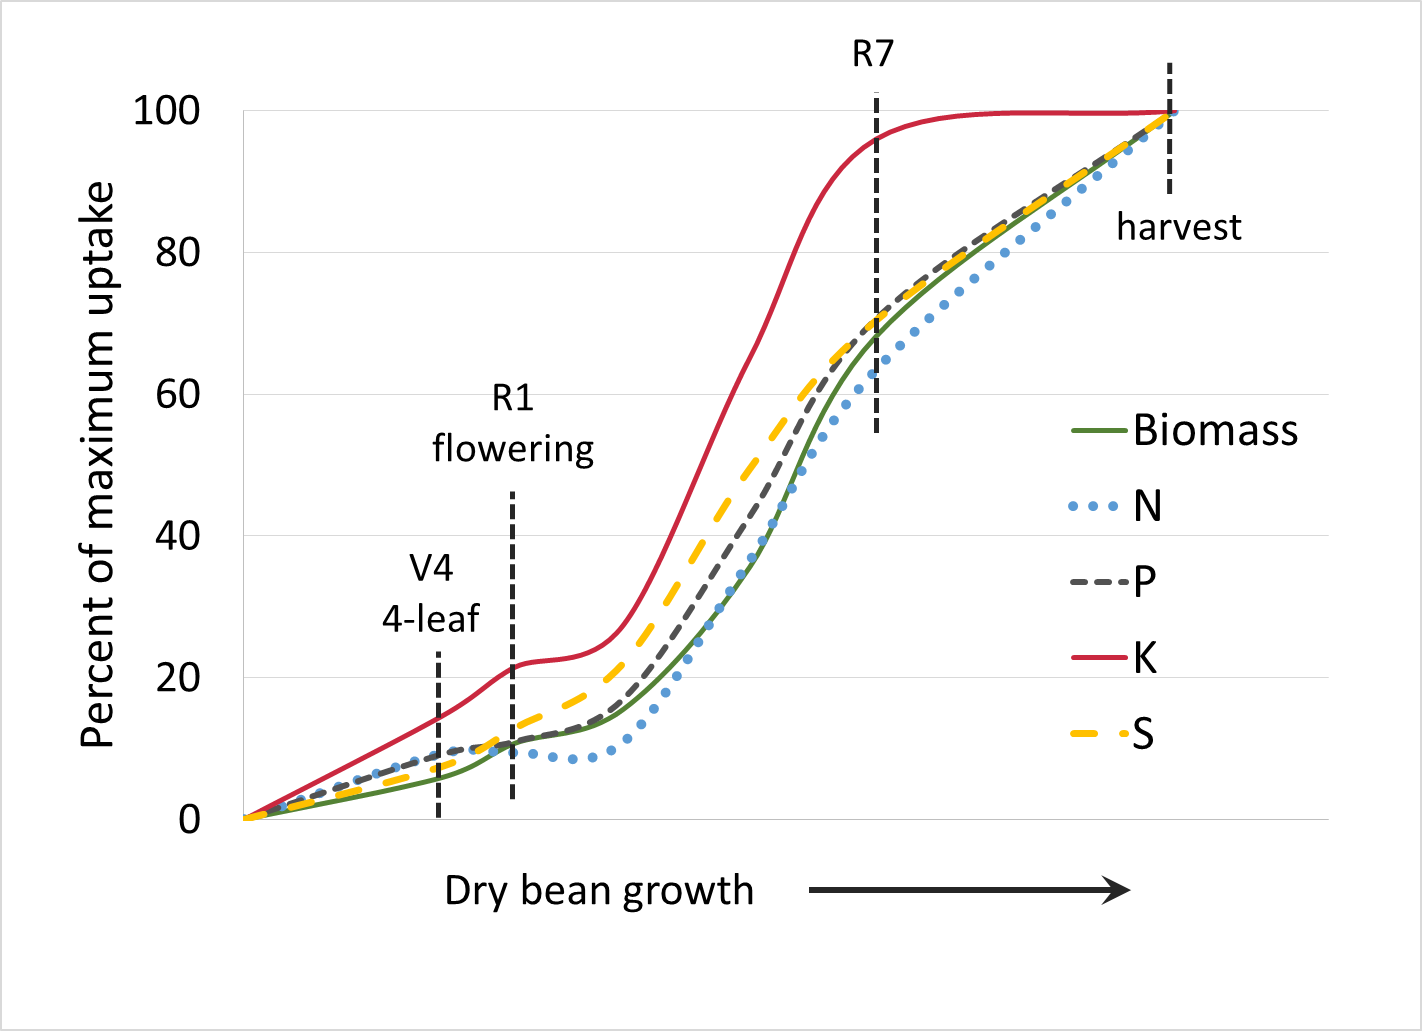
Source: Heard, J., and B. Brolley. 2008. Nutrient uptake and partitioning by dry beans in Manitoba. In Proc. of 2008 Manitoba Agronomist Conf.
Estimated nutrient removal in harvested dry bean (Fertilizer Guidelines for Montana Crops)
|
Crop
|
Unit
|
lb/bu
|
N
|
P2O5
|
K2O
|
Ca
|
Mg
|
S
|
Fe
|
Zn
|
Mn
|
Cu
|
B
|
|---|---|---|---|---|---|---|---|---|---|---|---|---|---|
|
— lbs —
|
|||||||||||||
|
Dry bean
|
bu
|
60
|
3
|
0.79
|
0.92
|
0.18
|
0.06
|
0.52
|
0.03
|
0.004
|
0.002
|
0.0015
|
0.003
|
Canola

Source: Karamanos, R.E. 2013. Nutrient uptake and metabolism in crops. Prairie Soils & Crops Journal. 6:52-63.
Estimated nutrient removal in harvested canola seed (Fertilizer Guidelines for Montana Crops)
|
Crop
|
Unit
|
lb/bu
|
N
|
P2O5
|
K2O
|
Ca
|
Mg
|
S
|
Fe
|
Zn
|
Mn
|
Cu
|
B
|
|---|---|---|---|---|---|---|---|---|---|---|---|---|---|
|
— lbs —
|
|||||||||||||
|
Canola seed
|
bu
|
50
|
1.94
|
1.17
|
0.60
|
-
|
-
|
0.34
|
-
|
-
|
-
|
-
|
-
|
Corn
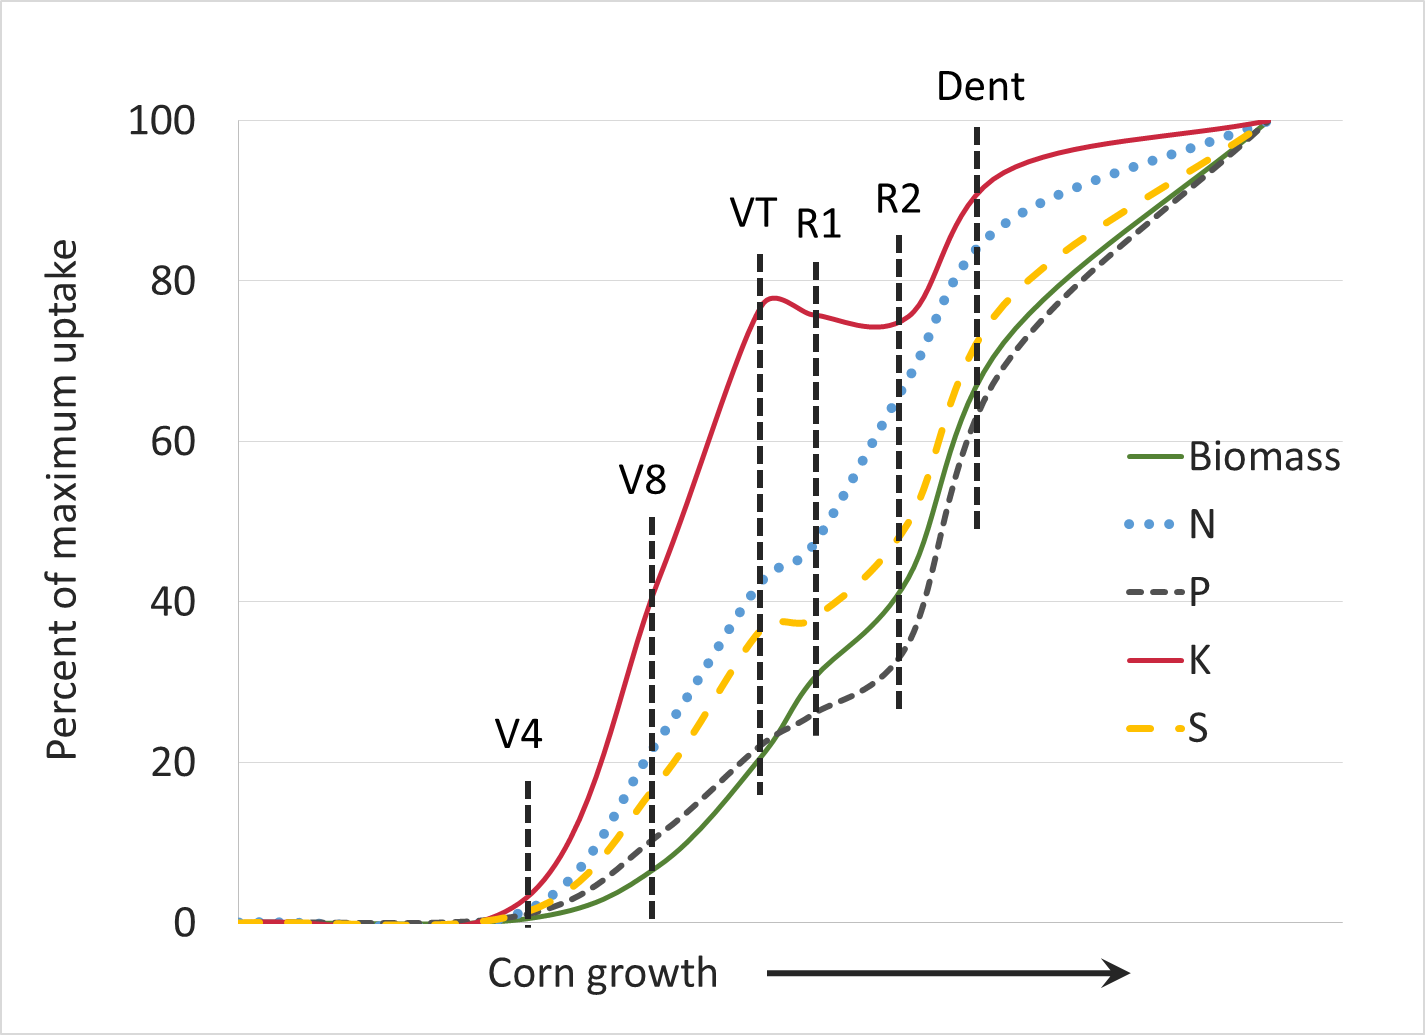
Source: Heard, J. 2006. Nutrient accumulation and partitioning by grain corn in Manitoba. In: Great Plains Soil Fertility Conference Proceedings. A. Schlegel (ed). Vol. 11. March 7-8, 2006. Denver, Colorado. p. 180-185.
Estimated nutrient removal in harvested portion of corn (Fertilizer Guidelines for Montana Crops)
|
Crop
|
Unit
|
lb/bu
|
N
|
P2O5
|
K2O
|
Ca
|
Mg
|
S
|
Fe
|
Zn
|
Mn
|
Cu
|
B
|
|---|---|---|---|---|---|---|---|---|---|---|---|---|---|
|
— lbs —
|
|||||||||||||
|
Corn - grain
|
bu
|
56
|
0.73
|
0.60
|
0.27
|
0.015
|
0.05
|
0.07
|
0.0055
|
0.001
|
0.0006
|
0.0004
|
-
|
|
Corn - stover
|
ton
|
-
|
19.8
|
8.8
|
40
|
5.8
|
4.5
|
3.2
|
-
|
0.067
|
0.33
|
0.01
|
-
|
|
Corn - silage
|
ton
|
-
|
9.7
|
3.1
|
7.3
|
-
|
-
|
1.1
|
-
|
-
|
-
|
-
|
-
|
Grass

Source: Hart, J.M., D. Horneck, D. Peek, and W.C. Young, III. 1989. Nitrogen and Sulfur Uptake for Cool Season Forage and Turf Grass Grown for Seed. Oregon State Crop and Soil Extension. No longer available online. Contact us if you need a copy of the document.
Estimated nutrient removal per ton of grass (Fertilizer Guidelines for Montana Crops)
| Crop | Unit | N | P2O5 | K2O | Ca | Mg | S | Fe | Zn | Mn | Cu | B |
|---|---|---|---|---|---|---|---|---|---|---|---|---|
| — lb/ton — | ||||||||||||
| Grass | ton | 25 | 10 | 38 | 7 | 2.5 | 2 | - | 0.08 | 0.13 | 0.01 | - |
Lentil
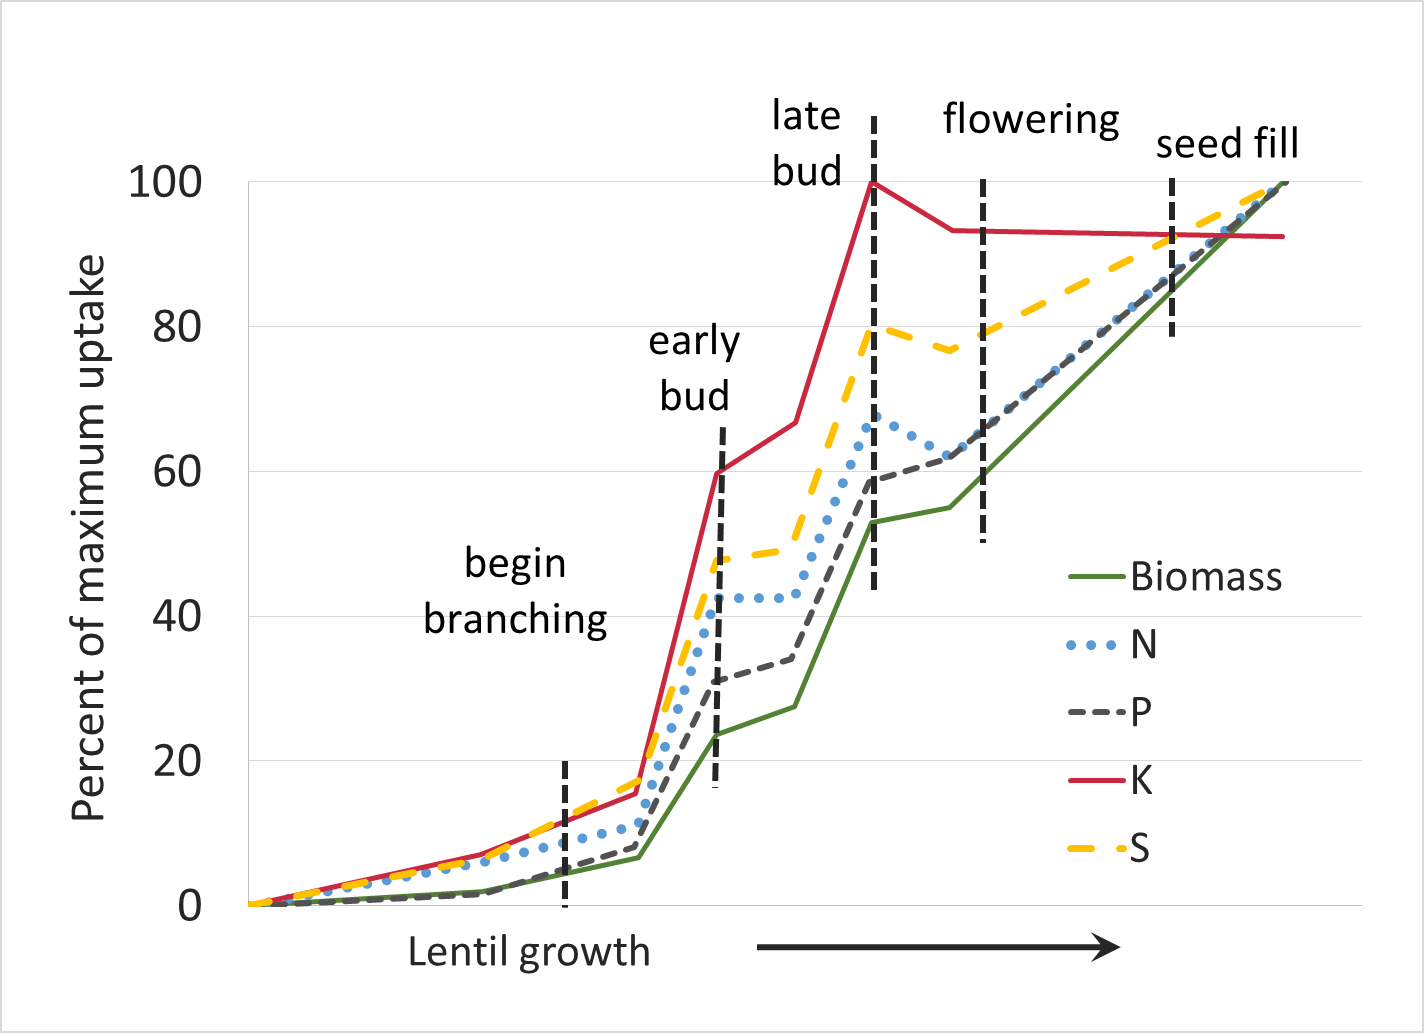
Source: Malhi. S.S., A.M. Johnston, J.J. Schoenau, Z.H. Wang, and C.L. Vera. 2007. Seasonal Biomass Accumulation and Nutrient Uptake of Pea and Lentil on a Black Chernozem Soil in Saskatchewan. Journal of Plant Nutrition. 30:721-737, DOI: 10.1080/01904160701289578
Estimated nutrient removal in harvested lentil seed (Fertilizer Guidelines for Montana Crops)
|
Crop
|
Unit
|
lb/bu
|
N
|
P2O5
|
K2O
|
Ca
|
Mg
|
S
|
Fe
|
Zn
|
Mn
|
Cu
|
B
|
|---|---|---|---|---|---|---|---|---|---|---|---|---|---|
|
— lbs —
|
|||||||||||||
|
Lentil
|
bu
|
60
|
2.18
|
0.67
|
0.87
|
-
|
-
|
0.15
|
-
|
-
|
-
|
-
|
-
|
Pea
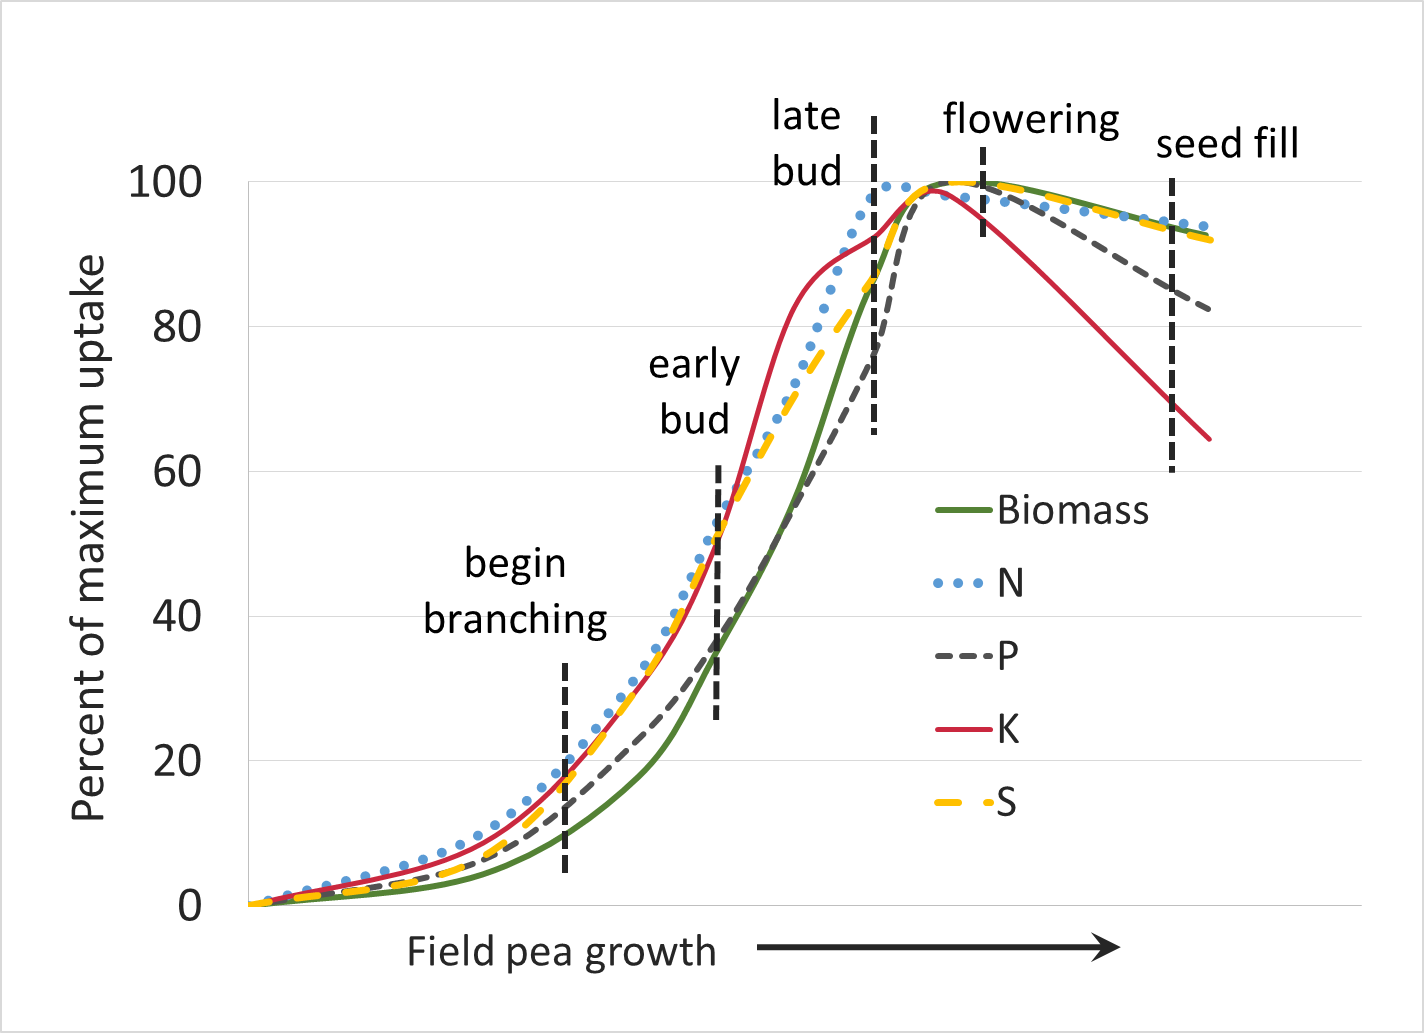
Source: Malhi. S.S., A.M. Johnston, J.J. Schoenau, Z.H. Wang, and C.L. Vera. 2007. Seasonal Biomass Accumulation and Nutrient Uptake of Pea and Lentil on a Black Chernozem Soil in Saskatchewan. Journal of Plant Nutrition. 30:721-737, DOI: 10.1080/01904160701289578
Estimated nutrient removal in harvested dry pea (Fertilizer Guidelines for Montana Crops)
| Crop | Unit | lb/bu | N | P2O5 | K2O | Ca | Mg | S | Fe | Zn | Mn | Cu | B |
|---|---|---|---|---|---|---|---|---|---|---|---|---|---|
| — lbs — | |||||||||||||
| Dry pea | bu | 60 | 2.18 | 0.67 | 0.87 | - | - | 0.15 | - | - | - | - |
- |
Potato

Source: Heard, J. 2004. Nutrient uptake and partitioning by potatoes in Manitoba. In Proc. of 2004 Manitoba Agronomist Conf.
Estimated nutrient removal in harvested potato tubers (Fertilizer Guidelines for Montana Crops)
| Crop | Unit | lb/bu | N | P2O5 | K2O | Ca | Mg | S | Fe | Zn | Mn | Cu | B |
|---|---|---|---|---|---|---|---|---|---|---|---|---|---|
| — lbs — | |||||||||||||
| Potato | bu | 55 | 0.2 | 0.13 | 0.38 | 0.009 | 0.02 | 0.38 | 0.16 | 0.0001 | 0.0002 | 0.0001 |
0.0001 |
Sugar beet

Source: De, M., A. Moore, and R. Mikkelsen. 2019. In-season Accumulation and Partitioning of Macronutrients and Micronutrients in Irrigated Sugar Beet Production. J. of Sugar Beet Research. 56:54-78.
Note: N application at or after canopy closure is not recommended (Malnou et al. 2006 doi:10.1016/j.eja.2006.06.002; Norton 2011 doi:10.1094/CM-2011-0829-01-RS; A. Moore Oregon State Univ. pers. com.). Nitrate taken up by roots during root bulking and sugar production reduces sugar quality.
Sunflower

Source: Heard, J., and R. Park. 2008. Nutrient uptake and partitioning by sunflowers in Manitoba. In Proc. of 2008 Manitoba Agronomist Conf.
Estimated nutrient removal in harvested sunflower seed (Fertilizer Guidelines for Montana Crops)
|
Crop
|
Unit
|
lb/bu
|
N
|
P2O5
|
K2O
|
Ca
|
Mg
|
S
|
Fe
|
Zn
|
Mn
|
Cu
|
B
|
|---|---|---|---|---|---|---|---|---|---|---|---|---|---|
|
— lbs —
|
|||||||||||||
|
Sunflowera
|
bu
|
28
|
1.06
|
0.32
|
0.24
|
-
|
0.10
|
0.08
|
-
|
-
|
-
|
-
|
- |
|
Sunflowerb
|
bu
|
28
|
0.8
|
0.31
|
0.25
|
0.06
|
0.09
|
0.05
|
0.001
|
0.0008
|
0.0006
|
0.0003
|
0.0006 |
|
a. Fertilizer Guidelines for Montana Crops b. Manitoba Agriculture, Food and Rural Initiatives – median value of range published. See source listed above. |
|||||||||||||