
A River Runs Through It…Until It Doesn’t: Water Issues and Solutions
Fall 2013 LRES Capstone Research Paper
Montana State University
Laura Bosacker, Keenan Brame, Margaret Franquemont, Darcy Goodson, Ernest Haglund, Alex Herbert, Elizabeth Hummelt, Danielle Kadrmas, Stephanie Kerns, Ethan Mayes, James Osborn, Jeffrey Patriarche, Matthew Richards, Brian Smith, Anthony Stewart, Shane Stoner, Holly Suchy, Alexandra Talbot, Ethan Williams, Elizabeth Zignego
Table of Contents
Abstract
1.0 Introduction
1.1 The Status of Freshwater
1.2 The Global Water Cycle and Its Effect on Earth Processes
1.3 Impacts on Surface Flow in Montana
1.4 Ground Water Resources
2.0 Water Policy and Regulation
2.1 Introduction
2.2 Surface Water and Appropriation
2.3 Groundwater
2.4 Future Policy
2.5 Water Quality Regulation
2.6 Point Source Pollution
2.7 Non-Point Source Pollution
2.8 Management Practice and Implementation
3.0 Desalinization
3.1 Introduction and Overview
3.2 Innovative Technology
3.3 Reverse Osmosis
3.4 RO Membrane Improvement
3.5 Hybridization and Coupling
3.6 Alternative Energy
3.7 Current Use
3.8 Environmental Impacts and Mitigation
3.9 Future Use and Implementation
4.0 Wastewater Treatment and Reuse
4.1 Introduction
4.2 Gray Water Reuse
4.3 Black Water Reuse
4.4 Effluent Reclamation Technologies
4.5 Irrigation with Wastewater
4.6 Conclusions and Applications
5.0 Water Use Efficiency
5.1 Water Use in Agriculture
5.2 Approaching Water Scarcity in Bozeman, Montana
5.3 Water Use Reduction Example: Montana State University – Bozeman
5.4 Residential Use in the United States
5.5 Residential Efforts to Lower Water Use
6.0 Conclusion
7.0 References
Abstract
Freshwater, as a human and ecological resource, is becoming scarcer. As the world population climbs, this fact becomes even more relevant. Climate change and variability is affecting the physical distribution of water, while its usability is often limited by pollution. Groundwater depletion due to overuse is common, further reducing access to clean water. In the United States, legal systems struggle to keep pace with new technologies like desalinization that may provide an emergent source of fresh water. Our research suggests that desalinization technology could furnish reasonable solutions to local water scarcities. Provided that desalinization plants are integrated with sustainable power sources and responsibly use marine resources. Increased agricultural and domestic water use efficiency can also drastically reduce the demand on currently available water resources. Additionally, systems and technologies that allow for wastewater reuse not only increase efficiency, but also show potential, beneficial use in agriculture due to high nutrient concentration of wastewater. Creative solutions to the global water shortage are necessary for every unique situation. Continued water use by the world’s growing population depends on implementation of available technologies for the refinement of salt water, and increasing efficient use of worldwide freshwater sources. We conclude that these methods can help alleviate the coming crisis.
1.0 Introduction
1.1 The Status of Freshwater
Many resources in the world are becoming stretched to their limit and freshwater is no exception. Freshwater scarcity is widespread and increasing across the globe. Limiting access to freshwater is a crisis that affects the fundamental resources needed for life and has extremely harsh consequences for the human population. The fact that water is a finite resource is a hard concept to grasp for many people. In the northern regions of the world where freshwater is more abundant, it is often treated like an unlimited resource. Water use is being stretched beyond just drinking and household use. Agriculture and industry consume most of the freshwater by a huge margin, driving the need to incorporate efficiency into our water use and ensure the continuation of the resource in the future.
Freshwater scarcity is very prevalent for a large percentage of the world’s population. Currently, 1.2 billion people live in areas with physical water scarcity, which is defined as “more than 75% of river flows are withdrawn for agriculture, industry, and domestic purposes” (IWMI 2007). Furthermore, 783 million people do not have safe drinking water (United Nations 2013). These statistics are not just limited to people in developing countries. There are also signs of water stress in the United States such as aquifer depletion and impaired water sources. As demand for products requiring water increases, so does water scarcity, and people living where water is already limited could face a worsening problem in the future as water resources thin.
Poor or inadequate sanitation and the inability to provide people with safe drinking water contribute to scarcity. In developing countries, 70% of untreated industrial waste is dumped into rivers and streams (National Geographic 2013). Additionally, there are around 1.1 billion people living in primarily rural areas that lack adequate sanitation. In these areas, human defecation potentially affects freshwater resources. Human waste contamination affects 55% of the population in Southeast Asia (UNICEF and WHO 2012). Many diseases prevalent in developing countries result from unsanitary water, including cholera which increased by 130% from 2000-2010 (United Nations 2013). Diarrheal diseases are the leading cause of illnesses and deaths in developing countries, with a large proportion of those diarrheal deaths resulting from poor water sanitation and inadequate water quality for hygiene and drinking water (United Nations 2013).
There is some good news on the sanitation front. The UN stated more than 2 billion people have gained access to improved drinking water and 1.8 billion gained access to improved sanitation from 1990-2010 (United Nations 2013). There has also been a decrease in human defecating into freshwater resources, with the number of people using this practice dropped by 234 million from 2010 to 1990 (UNICEF and WHO 2012). There are ongoing efforts to continue these trends in developing countries.
Concerns also exist in the United States for water quantity, quality, and pollution. According to the EPA, agricultural nonpoint source pollution is the leading cause of impacts in lakes and rivers, as well as the second largest source of impairments to wetlands. The EPA (2004) also reported that water quality was impaired in 44% of rivers, 64% of lakes, and 30% of estuaries. The causes of most of these impairments are pathogen, metal, and nutrient contamination.
Freshwater resources currently exceed global human requirements, but the rate of use is rapidly decreasing total available water to unsustainable levels. Regional water demands often exceed water supply and are exacerbated by increasing populations and society’s changing water needs. In the next half century the world will face a water scarcity challenge. Evidence of current and continuing trends in climate variation and land use points toward the likelihood that the number and extent of water-scarce regions globally will increase. Understanding the interactions and changes in the global water cycle will help us manage our water supply to ensure life on Earth has access to a sufficient amount of clean water. To confront this challenge, we must develop creative solutions that increase water use efficiency and water access for a growing population.
1.2 The Global Water Cycle and Its Effect on Earth Processes
Water is an integral part of the Earth’s processes and a key part of energy, geological, and biological cycles. Driven by solar energy from the sun, water continuously moves through the water cycle by evaporation, condensation, precipitation, infiltration, runoff, and subsurface flow. It is estimated that there are 332.5 million cubic miles of water in and on the Earth, 97% of which is saline ocean water. Of the remaining freshwater, 68.6% is held in glaciers and icecaps, while 30% is groundwater, and just 0.3% is surface water contained in lakes, swamps, and rivers(Shiklomanov 1993; Table 1). Natural climate variability, groundwater hydrology, and land use are interlinked by strong relationships. Even small changes in one part of the global water cycle can create a cascading series of events with major impacts on water availability, potentially presenting serious challenges to the quantity and quality of our water supply (Harding et al 2011).
Only 0.001% of all of the Earth’s water is in the atmosphere, but it is the central player in our climate systems. Variability in precipitation and climate around the world often results in prolonged periods of drought or intensified flood cycles (Tomer and Schilling 2009). Changes in weather patterns in the Mediterranean, western and southern Australia, and the Andes have caused severe droughts in recent decades with future impacts projected to be worse. For example, current trends in climate variability have resulted in less snow and more rain in the western mid-latitudes of North America. This tends to increase the rate of early season snow melt and discharge flows in rivers, while generally resulting in drier summers, creating major impacts on water storage, groundwater recharge and agricultural food production (Harding et al. 2011). Reduced stream flow volumes in the summer are often accompanied by increased stream temperatures, leading to disruptions of aquatic ecosystems (Larson 2012). Conversely, other regions such as the eastern U.S. and Europe are being subjected to trends of higher precipitation and more frequent flooding, often detrimentally affecting agricultural production.
Table 1 Estimate of global water distribution (Shiklomanov 1993).
| Water Source | Water Volume, in cubic miles | Water Volume, in cubic kilometers | Percent of Freshwater | Percent of Total Water |
|---|---|---|---|---|
| Oceans, Seas, & Bays | 321,000,000 | 1,338,000,000 | -- | 96.54 |
| Ice Caps, Glaciers, & Permanent Snow | 5,773,000 | 24,064,0000 | 68.6 | 1.74 |
| Groundwater | 5,614,000 | 23,400,000 | -- | 1.69 |
| Fresh | 2,526,000 | 10,530,000 | 30.1 | 0.76 |
| Saline | 3,088,000 | 12,870,000 | -- | 0.93 |
| Soil Moisture | 3,959 | 16,500 | 0.05 | 0.001 |
| Ground Ice & Permafrost | 71,970 | 300,000 | 0.86 | 0.022 |
| Lakes | 42,320 | 176,400 | -- | 0.013 |
| Fresh | 21,830 | 91,000 | 0.26 | 0.007 |
| Saline | 20,490 | 85,400 | -- | 0.007 |
| Atmosphere | 3,095 | 12,900 | 0.04 | 0.001 |
| Swamp Water | 2,752 | 11,470 | 0.03 | 0.0008 |
| Rivers | 509 | 2,120 | 0.006 | 0.0002 |
| Biological Water | 269 | 1,120 | 0.003 | 0.0001 |
Rapid snow-melt and periods of heavy rainfall result in more runoff discharge in a shorter period of time and increase the risk of flooding. Man-made reservoirs are intended in part to offset seasonal changes and store water for drinking, agriculture, energy production, and shipping and transportation. After nearly two decades of mild drought that left reservoirs in the Missouri River Mainstem Reservoir System throughout Montana, North Dakota, South Dakota and Iowa at record low levels, high snowpack and heavy spring rains in 2011 filled most of them to maximum capacity. The excess water that had to be released added to the heavy rainfall in the Midwest and overwhelmed the Mississippi River watershed. This resulted in flooding that damaged dam infrastructure and bridges, breached wastewater containment barriers, releasing contaminants into our water systems, and delayed or prohibited crop plantings (U.S. Army Corps of Engineers 2012). In Montana, tributary rivers experienced flow volumes that far exceeded bankfull discharge of recent history and overwhelmed communities like Roundup on the Musselshell and Huntley on the Yellowstone, and erosion on the Missouri River itself threatened containment of the sewage lagoons at Wolf Point (USDA-NRCS 2012).
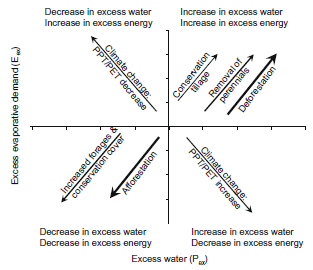
Figure 1. Conceptual model of hydrologic shifts associated with changes in climate and land use (Tomer and Schilling).
Studies on four Mississippi River tributary watersheds - the Vermillion and Embarras Rivers in Illinois, the Raccoon River in Iowa, and the Grand River in Missouri and southern Iowa - indicate that changing land uses play an important role in the increased water and nutrient transport into the river and Gulf of Mexico which greatly degrades water quality. In watersheds that provide a large proportion of the water flowing into the Mississippi River, agricultural practices have changed markedly since 1949 by replacing forests and perennial crops with annuals like soybeans and corn. Heavy tillage and fertilization practices associated with annual row crops have increased nutrient and sediment run-off that contribute to seasonal low dissolved oxygen in water that have caused an aquatic “dead zone” in the Gulf of Mexico. Tomer and Schilling (2009) concluded that land use change directly impacts the energy forces that drive evapotranspiration (ET) while precipitation (PPT) and potential evapotranspiration (PET) are not affected. For example, fallow, annual crop systems, deforestation and, urban development increase evaporative demand due to less vegetative ground cover which helps manage the water cycle. The effect of ET change results in shifts that will either increase or decrease surplus water and energy. However, PPT/PET ratios must change to increase surplus water and decrease surplus evaporative demand, or vice versa (Figure 1).
Changing land use also means that surface and groundwater are often exploited in unsustainable ways to meet urban, agricultural, industrial, and energy production needs, leading to long-term declines in groundwater levels (Harding et al. 2011). Sustainable agricultural methods are more important now than ever before to meet those changing needs.
1.3 Impacts on Surface Flow in Montana
Surface water availability and purity play an increasingly important role for landowners, farmers, and cities. Water issues encountered regularly include damming effects on surface flow in streams, erosion of agricultural lands in streams, and eutrophication. A large component of water control and dispersal throughout Montana is the installation of dams. Dams are important in the diversion of water to farms and populous areas as well as to provide an important clean source of electricity. However, the management of river and stream systems presents its challenges. Montanans increasingly have to tackle and monitor river issues and agricultural erosion that degrade surface water quality and lead to nutrient loss in soil profiles.
An issue that has a significant impact on both the ecological landscape and water storage is the installment of dams. Dams are not only a huge endeavor, but are also ironic in themselves because of the amount of water required to build a dam. A cubic yard of concrete incorporates approximately 202.5 gallons of water (Cubic Yards Converter 2013). The Hoover Dam took 4,360,000 cubic yards of concrete, using an estimated 883 million gallons of water to build. This is enough water to fill 1,330 Olympic sized swimming pools. An observational experiment looking at natural versus managed flows at the headwaters of the Columbia River Dam gives insight to the effects of dams on landscapes and farmers. The study showed that as water impoundments increase in size, their ability to match natural systems decreases. It also showed that human modification of spring flows presents future problems due to these basins being less resilient to environmental impacts than free flowing systems (Moore et al. 2012). Although dams have been a popular and necessary technology in the 20th century and still continue to be today, damming functions and impacts on the environment need to be monitored more closely. Dam functions and their effects on the environment depend on management, size, and location of water flows.
Numerous ecological effects of dams on landscapes have been studied for quite some time and are still being conducted in the U.S. and Montana today. These issues extend not just downstream of dams, but upstream as well. These observations of landscape changes are not a new concept. Studies overseas looking at landscape changes in the Yellow River Basin in Asia have been ongoing since 1977 (Ouyang et al. 2009) and regional landscape experiments such as the Oak Street Dam and LaValle Dam in Wisconsin are presently being observed (Stanley 2003). A nationwide study of U.S. dams found that river flows were affected all across the nation but less so in the Southeast and Midwest. This could be due to dam placement or management strategies. This study also showed that flow regimes were altered more with increasing dam size (Fitzhugh et al. 2010). Larger dams had effects on diversity shifts in aquatic ecosystems and decreased the size of some wetlands. This caused river system islands, sandbars, and shoots to become less prevalent. The alteration of the landscape also decreases tree growth, which affects bird diversity (Graf 2006). An experiment setup in the Columbia River Basin in western Montana supported the results on dam effects on flow regimes. Three headwaters, the Flathead, Boise, and Payette systems, were studied to determine their flow regimes. Both the Boise and Flathead systems, being the largest, had direct negative influences on flow. The modified minimum flows of both systems were much higher, leading to more variation in flow regimes. These regulated dams tended to release water sooner in the spring than their natural counterparts. The earlier spring melt and release shows a trend consistent with climate change. This combined with diversion of stream water can lead to dewatering of many of Montana’s rivers. The smaller Payette River on the other hand tended to match that of an unregulated regime, due to the dam’s limited effect on the system (Moore et al. 2012).
Apart from the regulation of water flow, dams also have impacts on aquatic life and water quality. When dams regularly release water or close their water ports, the water level in the lake fluctuates, creating a bathtub ring effect (HRC 2009). This area has little plant mass and cover to protect and encourage reproduction of smaller aquatic species, therefore lowering diversity. Dams are also sediment traps that accumulate sediments at their base over time. This disrupts the cycling of sediments from upstream to downstream systems, leaving areas downstream from dams with little sediments (International Rivers Corp. 2002). Silt buildup is an increasing problem in reservoirs because it not only reduces water storage, but decreases electricity production and leads to increased maintenance costs. Currently the U.S. spends over $520 million to dredge sediments from waterways (Pimentel 1995). The buildup of sediments can also create an anaerobic zone leading to low levels of oxygen and the release of phosphates from iron-bound hydroxides. Dams often release water from the lower areas, which leads to water with low oxygen and excess nutrients. This can result in many factors, including fish die off and eutrophication, which is explained in a later section (Davis and Koop 2006).
Dams not only serve as a storage basin but also can be used to divert water to agricultural lands. Once diverted, farmers use this water to sustain or increase crop yield. Though water is essential for maintaining upkeep of crops, there are downsides to over watering landscapes, including nutrient losses and eutrophication. Erosion of agricultural lands also plays a large part in economic loss of nutrients and water from the soil. This loss not only affects the potential yield of the crop, but also can cost the farmer more for fertilizers. Some methods developed by both farmers and scientists to counter these issues have included contour plowing, which follows the topography of the land, planting filter strips in bank areas, cover crops, and planting trees as windbreaks in wind prone areas (Alberta 2001).
Overwatering can also cause over-enrichment and contamination of rivers, lakes and aquifers. Eutrophication simply means enriching an ecosystem with limiting nutrients such as nitrogen or phosphorus (Oregon State University 2012). This process occurs when either large rainfall events or over watering of agricultural land with nitrogen fertilizers leaches these limiting nutrients into underground water supplies which flow into streams, lakes, and oceans. Once these nutrients have entered these systems it causes rapid algal growth preceding massive die off. Decomposing bacteria break down the algal biomass, rapidly using the oxygen in the area. This massive reduction in oxygen in turn kills off aquatic life. These factors coupled with nitrate’s potential toxic effects on infants and livestock are giving incentive to test city water supply on a regular basis (EPA 2013).
Damming plays an important role in ecosystem processes and land management. Decreased flows and ecological effects on river systems are causing a significant change in many ecosystems. Water diverted from dams to crop lands should be controlled to limit erosion and prevent excess nutrients from leaching into subsurface water systems; which can cause eutrophication in surface waters. With continuing water shortages plaguing cities and farmlands, more information and studies need to be conducted on subsurface flows to predict and plan for increasing future water shortages. Though dams aid in many of these surface flow changes, aquifer depletion also plays an important role.
1.4 Groundwater Resources
Aquifers are an important water source for billions of people globally. Unfortunately, because of human withdrawal, many aquifers are being depleted at a faster rate than they are being recharged. 1.7 billion people live in places where groundwater resources are threatened by overuse (USGS 2013). In the United States, 15 million households use private wells as their primary water source (US Census Bureau 2008). In Gallatin County alone there are over 16,000 wells, with 171 new wells drilled this year (MBMT 2013).
Groundwater is the largest available source of freshwater in the world (Environment Agency 2013). Precipitation that infiltrates and percolates into the soil and is not absorbed by plants moves downwards towards an impermeable layer. This causes water to build up in the spaces between soil particles and fractures in rock, creating a saturated zone. The saturated zone closest to the ground surface is called the water table. Groundwater flows at a slower rate than surface water in rivers or streams, and is therefore stored for a longer period of time. When groundwater is collected in one place it is called an aquifer. An aquifer is an area of saturated soil that can be at any depth below the surface, but is generally divided into two types; confined or unconfined. Confined aquifers are beneath an impermeable layer of rock or soil while an unconfined aquifer’s saturated layers are at the water table without an impermeable barrier on top (Environment Agency 2013).
An aquifer can be thought of in much the same way as an above ground lake. Inputs from a large area flow to a single point, the lake, which is a small area compared to the total area that the water comes from. In the same way, a large land area is required for gathering precipitation to fill up an aquifer. Unlike surface water, the path that water takes through soil and rock filters and cleans the water, and is generally clean enough to use without additional treatment. The water can be accessed by drilling a well to the water table and pumping it out (Environment Agency 2013).
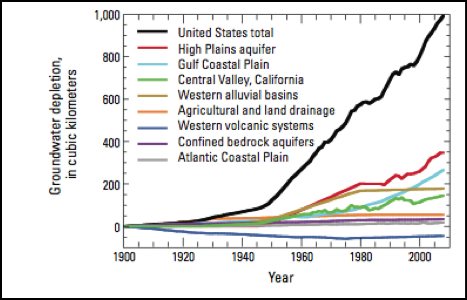
Figure 2. Cumulative groundwater depletion in the United States and major aquifer systems or categories, 1900-2008 (USGS 2013). The High Plains aquifer is also referred to as the Ogallala Aquifer.
The rate of withdrawals from most major aquifers across the U.S. is contributing to cumulative groundwater depletion (Figure 2). Between the years of 2000-2008, cumulative depletions were 25 km3 per year. That may not seem like a large number but it is the approximate equivalent of 2,533 Hyalite reservoirs being removed from the ground every year. This rate of withdrawal averages an 8-year period, but the rate has increased every year since 1950. The Ogallala Aquifer is an example of a water resource that is beginning to show signs of stress. The aquifer provides drinking water for almost 2 million people and provides 30% of the groundwater-fed-irrigation in the US. In the years 2001-2008 the water taken from the reservoir accounted for 32% of the entire depletion in the 20th century (Steward et al. 2013). A study done by researchers at Kansas State University showed that natural recharge can supply 15% of the current water being pumped out of the Ogallala aquifer. It would take between 500 and 1,300 years to completely recharge all of the depleted water. Because this aquifer is one of the main sources of water for the Great Plains, its preservation is crucial for future food security in the US (Steward 2013).
The over depletion of water is not the only threat to America’s water resources. Pollution and salt-water encroachment from the ocean also lead to unsafe drinking and agricultural water. In highly populated coastal regions, increased withdrawals from aquifers accompanied by decreased recharge can result in saline intrusion into the groundwater. These factors can have a profound effect on both the amount of water available and water quality. As water is pumped out of coastal aquifers, the amount of fresh water flowing underground to the ocean is greatly reduced. This leaves space where salt water from the ocean can seep inland laterally (USGS 2013). Coupled with a small but not insignificant rise in sea levels of 3-4mm per year during the 20th century, saltwater intrusions in coastal region surface waters bring an increasing threat to water supplies and ecosystem services (Larsen 2012). Even though water is abundant in Gallatin County, there are threats to water security. Leaching of toxic chemicals in groundwater have been identified at two locations in Bozeman, and rising nitrate levels throughout Gallatin Valley are also a concern.
The right of people to use water has always been a source of contention and only becomes more complicated as pressure on water increases. Increasing water scarcity and decreasing quality combined with a fast growing population are beginning to threaten the status quo. Creative solutions for water use efficiency and the exploration of innovative new technologies for water sources are the keys to future water security.2.0 Water Policy and Regulation
2.1 Introduction
Water is a contentious legal issue because it is unlike any other natural resource; it is scarce and is necessary for life. Water law in the U.S. encompasses two main topics, water rights and water quality. States are given the authority, from the federal government, over right appropriation and quality standards (U.S. Statues 253 Section 9, California v. United States 1978). The majority of states consider both rights and quality of surface water separately from groundwater (Tarlock et al. 2002).
2.2 Surface Water and Appropriation
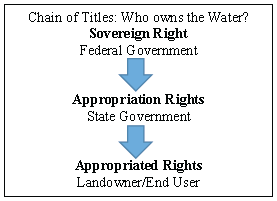
Figure 3. Chain of title showing basic ownership rights of water.
Surface water rights follow a method of appropriation of rights called a chain of title (Fig 3). These are dictated by two systems, riparian rule and prior appropriation, that are used to decide what order right-holders fall in the chain. States can choose their own water laws and doctrines, but the majority use some mix of the two. The majority of the states west of the 100th meridian (halfway across the Great Plain states) use only prior appropriation while the majority of the eastern states include more riparian rule (Coggins et al. 2007). Riparian rule is an older system that gives water rights to riparian land owner, and is generally only effective in non-water limited systems (Coggins et al. 2007, Tarlock et al. 2002). In the U.S., English Rule encompasses both natural flow and reasonable use doctrines (Coggins et al. 2007, Tarlock et al. 2002). Natural flow is the idea that river water cannot be diminished in quantity or quality for downstream riparian landowners (Tarlock et al. 2002). Natural uses, including stock watering and agriculture take precedent for water use over artificial uses (Kundel Farms v. Vir-Jo Farms Inc. 1991). The importance of natural flow versus reasonable use can change depending on what riparian landowners are using the water for (Harris v. Brooks 1955). Often riparian water rights are unlimited until they impact the riparian water rights of someone else (Hoover v. Crane 1960, Pyle v. Gilbert 1980).
Prior appropriation is the “first come, first serve” doctrine where non-riparian landowners can divert water from the river channel for other uses. There are two requirements that someone looking to gain water rights must meet in order to be given rights; they must intend to use the water and they must actually apply it to beneficial uses ([New Mexico] ex rel. Reynolds v. Miranda 1972, Coggins et al. 2007). Beneficial use generally includes agricultural and industrial uses (Tarlock et al. 2002). The idea of prior appropriation is that the earlier appropriations have more right to the water than later appropriations (Coggins et al. 2007). In times of shortages, junior appropriators would lose their water rights first regardless of their location upstream or downstream ([Nebraska]ex rel. Cary v. Cochran 1940). Additionally, water reuse can impact downstream appropriations and can increase or decrease water use efficiency (Tarlock et al. 2002). This means that reuse is not always included in the original water rights (Estate of Steed v. New Escalante Irrigation Co. 1992).
In addition to this doctrine framework there are specific rules about allocating water to different uses including mining, agriculture, electrical power, cities, and recreation (Coggins et al. 2007, Tarlock et al. 2002). These rules differ state to state but generally include amount of water allotted, permissible types of diversions and storage, and what the water use includes (Tarlock et al. 2002). There are also very strict procedures for moving water from one watershed to another, a practice especially prevalent in areas surrounding the Continental Divide (Tarlock et al. 2002).
2.3 Groundwater
Groundwater law development did not keep pace with the development of the technology to access groundwater. It wasn’t until 1971 that courts formally recognized that science could understand and monitor groundwater movement and aquifers (Higday v. Nikolaus) despite much earlier development of this resource; therefore nearly every state developed its own groundwater management system (Tarlock et al. 2002). The majority of ground water problems are concerned with common pool problems because everyone is accessing the same resource pool (Campbell- Mohn et al. 1993, Tarlock et al. 2002). This means that there is incentive to drill unnecessary wells so that you can get more water than your neighbor, often resulting in unnecessary water extraction (Campbell-Mohn et al. 1993). Additionally, where a prior appropriation system is in place, wells are often drilled excessively early in order to ensure access to water (Tarlock et al. 2002). With no regulation, this type of pumping will pull more water out of the system annually than what can recharge the system, resulting in aquifer “mining”(Tarlock et al. 2002). The majority of state groundwater plans, doctrines, or commissions prohibit aquifer depletion in rechargeable systems (Campbell-Mohn et al. 1993, Tarlock et al. 2002). Many of the states use a prior appropriation doctrine but it is not as cut and dry as surface water. For example, Higacy v. Nikolaus (1971) found that one landowner may not withdraw groundwater for profit if an adjoining landowner is denied reasonable use. Additionally a senior appropriator is only protected to the extent of “reasonable ground water pumping levels” which means their rights might be diminished for the benefit of the aquifer (Baker v. Ore-Ida Foods Inc. 1973). Unlike surface water, non-appropriated groundwater is not necessarily available for new permits and wells because it could potentially impact the current water rights (Fundinsland v. Colorado Groundwater Commission 1970). In areas of non-recharging aquifers, perpetuity of rights is an assumed part of the existing rights so new wells may be added without impairing existing rights (Mathers v. Texaco, Inc. 1966).
2.4 Future Policy
As technology advances, law will have to progress to fairly distribute new water rights as they become available. For example, desalinization is one of the more prominent new methods of obtaining fresh water. However, legal rights to desalinized water do not fit into any currently used water rights doctrine or system without some assumptions being made (Pappas 2011). Generally, the state handles all water appropriation, but a series of cases in the mid-20th century, known as the Tideland cases, gave the federal government the right to everything seaward of the low tide mark with the exception of oil and gas reserves (United States v. California 1947, United States v. Louisiana 1960, United States v. Texas 1950). Though seawater is not explicitly mentioned, the Tideland cases would imply that the federal government has the authority to appropriate water rights for seawater. After desalinization the question becomes who owns the fresh water: the desalinator or the municipalities who use the fresh water (Pappas 2011). Labor theory would give equal rights to the desalinator and the municipalities or give the municipalities a contractually lesser degree of water rights (Pappas 2011). However, both the public trust doctrine and the prior appropriations doctrine would give the majority of the water rights to the municipalities, because they have a beneficial end use and are ensuring an appropriate use of public resources as proxies for the public water user (Pappas 2011). It has been shown in both Nevada v. United States (1983) and Ickes v. Fox (1943) that a vested interest in the form of beneficial use or an obligated trust receives more water rights than just conveyance of water. Ultimately, the current laws would give the majority of rights to the saltwater to the federal government and the majority of the rights to the freshwater to the municipalities acting as a proxy for the end users (Pappas 2011). As the technology improves and desalinization becomes a greater water source, lawmakers will need to examine the current laws and doctrines to determine whether they are appropriate for desalinization or whether a new doctrine will need to be developed (Pappas 2011).
2.5 Water Quality Regulation
In addition to water quantity, water quality has been a focus of federal legislation. Created as an amendment to the Federal Water Pollution Control Act of 1948, the Clean Water Act strives to “ . . . maintain the chemical, physical and biologic integrity of the nation’s waterways…” (Anon 2002). Amendments in 1972 regulated pollutants and set standards for water quality (Anon 2013). The Environmental Protection Agency (EPA) oversees the implementation and enforcement of the Clean Water Act effluent standards. These standards were set by EPA regulators, but allowed states to set their own more stringent regulations (Trimble 2013). Clean Water Act standards and permits target point source pollution in navigable waterways, from industry and domestic use.
2.6 Point Source Pollution
Point source pollution control is one of the main goals of the Clean Water Act because it is more manageable than determining nonpoint sources; specific activities polluting the water can be determined and a permitting plan can be implemented (De Muizon 2005). The National Pollutant Discharge Elimination System (NPDES) is a product of the Clean Water Act and targets industrial point-source pollution.
Industrial NPDES permits encourage companies to be compliant with EPA standards (Wagner 2009, Perrone 2013). Companies in possession of an NPDES permit must comply with best management practices and technologies (Laitos 2013) or face citizen suits, which address violations of water quality standards (Citizen Suit Enforcement 2011). Any person adversely affected by a permit violation, usually a downstream party, can file a citizen suit. A grace period for compliance begins once the polluting party is notified; if compliance is not achieved in 60 days then legal action against the permit holder can proceed (Citizen Suit Enforcement 2011).
States can set stricter standards for NPDES permits than the EPA (Perrone 2013), but there are pitfalls when a state standard is less stringent than the EPA standards. A disconnect between state and federal standards is illustrated in Louisiana Environmental Action Network v. City of Baton Rouge. The suit took place in Jefferson County, Louisiana, which experienced rapid population growth throughout the 1970s and ‘80s. Wastewater treatment plants of Jefferson County were not designed to support such rapid growth. As a result, when flows exceeded the capacity of the treatment plant, the water was marginally treated by a “bypass” system then returned to the waterway. This “bypass” system was in violation of the Clean Water Act and actions were taken to upgrade the wastewater treatment plants (Perrone 2013). The state had allowed the plant to operate with a bypass, when in reality the state was in violation of federal Clean Water Act regulations. Jefferson County received 90 million dollars in assistance from Congress and the federal government in the first decade after the Clean Water Act was enacted (Perrone 2013). Water quality downstream was improved after improvements were made to the plant.
2.7 Non-Point Source Pollution
In some geographic areas water quality in navigable waterways is not improved by industrial compliance with NPDES permitting. This can happen when pollutant loads originate from a non-point source. Non-point source pollution often comes from multiple agricultural systems (Laitos and Ruckriegle 2013). Excess fertilizer runoff can decimate a waterway, and under the Clean Water Act there is no specific solution to non-point source pollution from agriculture. The Clean Water Act and the federal government specifically exempt return flow from agriculture from needing any form of permitting or pollution ownership (Laitos and Ruckriegle 2013). This exemption makes decreasing pollutant loads in streams extremely difficult, even when companies are in compliance with NPDES permitting on a waterway. Clean Water Act legislation presents technology-based solutions, which often cannot be implemented in agricultural settings. The EPA gave the authority to regulate non-point source pollution to the states. States are now working with farmers to implement best management practices within their borders (Laitos and Ruckriegle 2013).
2.8 Management Practice and Implementation
Two sections of the Clean Water Act, sections 208 and 319, guide states on how to implement best management practices for agricultural pollution and water quality. These sections mainly concern planning processes and clean up or prevention. States must develop “area wide treatment plans” that are reviewed by the EPA (Laitos and Ruckriegle 2013). There are no monitoring guidelines to determine the effectiveness of an implementation plan on reducing nonpoint source pollution. The EPA cannot determine whether a specific treatment plan addresses the full scope of the problem. Two incentives from the EPA and the Clean Water Act are that states have access to federal grants and that they can enter into cost-sharing contracts between farmers and the Department of Agriculture (Laitos and Ruckriegle 2013). Agriculture pollution cannot completely be mitigated by grants and contracts; section 319 of the Clean Water Act creates programs to implement best management practices for states. These programs are useful, but do not provide for the monitoring and enforcement of best management practices (Laitos 2013).
3.0 Desalinization
3.1 Introduction and Overview
Ideally, every one of us should be more efficient with our water, whether it’s agricultural, industrial, or domestic use. In reality, this is not going to happen overnight, so we need solutions now. An amazing, relatively new technology called desalinization allows humans to access the largest bank of water we have on our planet, the ocean. Although the ocean is much too saline (salty) for human use, we have the technology to remove the salts and make the water usable. Desalinization plants have been constructed all over the world in places such as Aruba, Florida, California, Australia, and the Middle East, particularly in the Arab Gulf countries. Gulf nation populations continue to expand so it has become essential to derive new water resources (Fritzmann 2007). The most commonly used desalinization process is reverse osmosis (RO); this process uses pressure to push water through a semipermeable membrane to yield fresh water, leaving a salt solution behind (Aintablian 2011). Multi-stage flash desalinization, a process that uses heat to distill the salt water, is another common method, but this requires even more energy than reverse osmosis (El-Dessouky 1995). Vast amounts of seawater are treated and desalinated on a daily basis, accounting for a worldwide water production of 24.5 million m3/day (Höpner and Lattemann 2007). New, energy efficient, less wasteful methods are currently being researched, providing a wealth of information for future companies to construct more efficient desalinization plants throughout the world.
However, this solution to water scarcity may lead to other problems. Oceanic currents may be disrupted depending on the scale of desalinization, and byproducts will need to be properly stored in order to prevent water quality problems. Desalinization has its downfalls, but it is more desirable than having the human population suffer from substantial water quantity and quality issues.
Currently, there are many desalinization plants around the world which use a process called multi-stage flash (MSF) desalinization. There are three sections to MSF: heat rejection, recovery, and brine heater (heat input section; El-Dessouky 1995). Essentially, heat is applied to the incoming water, inducing evaporation, and then the fresh water flows to a flash chamber. The flash chamber creates a salt-free water vapor, which is passed through a wire mist separator to remove specified brine droplets. Pressure is then altered to make the clean water condensate and fall back into a clean tank. This water can then be utilized for human use. While this procedure is very energy intensive, it can process larger volumes of saline water, and results in a higher water quality. Fortunately, due to the rich abundance of fossil fuels in the Middle East, this process is a plausible method for procuring fresh water.
3.2 Innovative Technology
Alternative or innovative technologies in desalinization processes have the potential to offer decreased energy use while still processing saline water for freshwater use. These technologies involve membranes, osmotic characteristics and electric fields. Electrodialysis is a method based on the movement of charged particles in an electrical field and is used primarily with brackish water rather than seawater. The primary difference between brackish water and seawater is the salt content. Generally any water that contains over 10,000 mg/L of dissolved solids is referred to as seawater, while water containing 1,000 to 10,000 mg/L is referred to as brackish (Alabama State Water Program). Electrodialysis relies heavily on new membrane technology. The membranes used in this process are permeable for anions, while the cations are held back. This method offers an advantage over reverse osmosis when there is a low ion concentration. Chemical and petrochemical industries currently use this technique to desalinate solutions. The problem with electrodialysis, like MSF, is the high energy consumption to desalinate the water, making its application to desalinating seawater extremely costly.
Similarly, the process of concentration polarization is used to desalinate seawater by manipulating a transport mechanism, which occurs when an ionic current is passed through an ion-selective membrane (Subramani et al. 2011, Elimelch & Phillip 2011). But, in new processes, no membrane is required. Instead, an electrical potential is used as a repulsion system in a microchannel, next to a nanochannel where electrical voltage is applied, resulting in the formation of two streams, treated water and concentrate. This process has comparable energy use as current desalination technologies and salt rejection, but has the advantage of having no fouling, due to no membrane usage.
An electricity dependent process, capacitive deionization, requires numerous pairs of high-surface area electrodes, which absorb ions from an inflow of saline water, effectively desalinating the water. Capacitive deionization is not a new technology but improvements in electrode material and process control could make it a valid alternative to the traditionally energy inefficient desalinization processes (Subramani et al. 2011).
3.4 Reverse Osmosis
Reverse osmosis is unlike its thermal alternatives MSF and electrodialysis; it has much lower energy costs. Osmosis occurs naturally due to differential concentration gradients. Water has the tendency to pass through a semipermeable membrane into a solution where the solvent concentration is higher, thus equalizing the concentrations of materials on either side of the membrane. This natural process, forward osmosis, can be manipulated in the desalinization process. Instead of using hydraulic pressure, as in traditional RO desalinization, a concentrated draw solution is used to generate a high osmotic pressure. This osmotic pressure is used to pull water across a membrane, which allows water molecules to pass through while selecting against salts and other contaminants. The draw solution and water extracted from the feed are then separated into freshwater and returned draw solutions. This process has advantages over traditional RO methods considering its lower energy consumption and lower fouling potential (Subramani et al. 2011). As with new technologies, this process requires more long-term studies and improving membrane properties to allow for specific selection.
Conversely, RO applies a pressure to the side with the higher concentration gradient, forcing the saline water through a membrane which can prevent up to 99.5% of salt (depending on the membrane) from passing through. This brine-free water can then be taken to a treatment center where pH along with other water quality adjustments can be made. Currently, RO is the most widely used membrane desalinization technique (Fritzman 2007). Europe has capitalized on this technology, especially on the island of Mallorca. This island had high rates of water consumption due to tourism and agriculture, forcing the island to import water at a costly rate. The solution was a RO desalinization plant, which reduced its water price and dependence on shipments from other European nations.
3.5 RO Membrane Improvement
Improvements in RO efficiency are focused on technical aspects of membrane construction and function. Current membrane improvement targets increases in salt rejection and permeability while reducing energy consumption (Subramani et al. 2011). New generation membranes have the potential to operate efficiently under reduced feed flow, which equates into less energy required to pump saline water through the membranes. These membranes can be broken into 3 groups: nanocomposite, nanotube and biomimetic. A breakthrough in RO would be membranes resistant to fouling and scaling, which allows for more efficient processing and less time spent maintaining membranes (Elimelech & Phillip 2011). Chlorine and other oxidants are effective anti-fouling agents, but the properties of membranes are susceptible to detrimental effects by chlorination. The complication in utilizing these advanced membranes in today’s desalinization plants is operators and owners require sound long-term data and confidence that the new technology will produce a better or equal product. They do not want to invest in new material without knowing that the product will work and be efficient for long periods of time. Each new generation membrane has different potential for reduced energy consumption, but the complications in application and requirements before application are summarized below.
Nanocomposite membranes are composed by dispersing zeolite nanoparticles within a traditional polyamide matrix RO membrane to produce a more permeable and fouling-resistant membrane (Subramani et al. 2011, NanoH2O, Inc. 2013). Studies have shown that nanocomposite membranes can increase flux while retaining optimal salt rejection and reduce energy consumption by 20% (Subramani et al. 2011). The reduction in energy use and increased flux is due to the increased permeability of the membrane (Penate & Garcia-Rodriguez 2012). While preliminary nanocomposite membranes seem promising, more research is necessary to determine the long-term potential, chemical stability and specific constituent removal of these membranes.
Nanotube membranes are produced by incorporating carbon nanotubes into RO desalinization membranes. A substantial increase (10x) in membrane permeability could result in a 30-50% reduction in energy usage (Subramani et al. 2011). These improvements in efficiency do not affect salt rejection, which stay consistent with current RO specifications. As with nanocomposite membranes, more long-term data, chemical stability and composition, and antifouling data are needed before nanotube membranes can be implemented in RO desalinization plants (Subramani et al. 2011, Ying Yang et al. 2013).
Membranes that use natural biological processes tailored into RO are known as biomimetic membranes. These membranes use aquaporin proteins, which act as water channels that selectively allow water molecules to pass through while ion transport is restricted by an electrostatic mechanism within the channel (Subramani et al. 2011). The potential for these membranes in RO processes could allow for 70% energy savings, due to their permeability characteristics, which are 100 times that of traditional RO membranes (Subramani et al. 2011). Current issues involved in the application of biomimetic membranes in RO desalinization are the same as with nanotube and nanocomposite membranes and their recorded inability to withstand high operating pressures (Subramani et al. 2011).
Advances in membrane technology can be hybridized into traditional RO processes. Using ultrafiltration to remove particulates, bacteria and viruses from source water, while using nanocomposite or nanotube membranes for the desalinization process, could allow for more efficient water production and reduce the amount of fouling and scaling on the susceptible nanocomposite membranes (Gude et al. 2010). Trends in improved membrane efficiency allow for more cost and energy efficient processing, but more research is needed before new generation membranes are accepted by desalinization stakeholders and implemented.
3.6 Hybridization and Coupling
While the desalinization process is overall energy inefficient, changes in system design and coupling of plants to alternative energy sources could provide for reduced energy consumption. Hybrid systems use steps of the RO processes in conjunction with other desalinization processes such as multi-stage flash distillation (Gude et al. 2010). The combination can be beneficial both technically and economically. Other examples of hybridization and system coupling include system homogenization, mega scale desalinization plants, proper selection of construction materials and anything else to ultimately supply readily available low-cost water by efficient desalinization (Subramani et al. 2011, Gude et al. 2010, Khawaji et al. 2008).
Plant design for coupling desalination processes with existing coastal power generation stations could reduce production costs. Coastal power plants use ocean water as a cooling agent, which is then discharged out of the plant. If this discharge water was fed straight into a desalinization plant, there would be less energy required for desalinization, because the cooling water from power plants is between 5-15 °C warmer than that of source water (Subramani et al. 2011), which translates into a lower feed pressure required for the desalinization process.
Recent advances involving the overall efficiency of the process have been made involving membranes used in RO, system design, energy recovery and use of heat sources. All of these involve minimizing the energy usage for desalinization processes. Increasing membrane potential and developing more permeable and selective membranes have been focal points for reducing energy use. This may be due to most desalinization processes using RO, a membrane intensive process. Hybridization of power plants with desalinization plants and desalinization processes with one another, as well as alternative forms of energy have been discussed as a possible solution to this energy consumptive process.
3.7 Alternative Energy
Alternative technologies used to power desalinization plants include solar, wind, geothermal, and wave. The revered renewable resource coupled system seems to be solar powered desalinization plants. Two approaches are used for solar energy coupling. The first uses the latent heat from the sun to evaporate seawater onto a solar still. Here the water will be cooled and precipitated off into a clean tank. The other method is to use solar power to produce electricity or mechanical energy to drive the plants. While solar options are of greatest interest, other energy sources to drive desalinization could be potentially viable.
Using wind-generated energy to power desalinization plants is an option as a renewable energy source. Wind turbines generate energy that is used to generate electricity, which can then be used in the desalinization process. This process has natural disadvantages such as unpredictable wind patterns and location specifics. Geothermal renewable uses steam energy to generate electricity to power the desalinization process. This process can also be used to increase flow input temperatures, which translates into a lower energy requirement. This process is also location limited, making it a valid option for energy production in specific places. Wave energy can be easily coupled with desalinization plants considering the relative proximity of most plants to the ocean. The concern here is the fluctuating character of wave energy (Mathioulakis 2007).
Current desalinization processes require large inputs of energy and contribute to greenhouse gas (GHG) emissions, but this energy-inefficient process provides freshwater to some regions of the world and will contribute to an increased proportion of the world’s water requirements in the future (Subramani et al. 2011, Elimelech & Phillip 2011, Penate & Garcia- Rodriguez 2012). Increasing knowledge and technological advancements have been effective in reducing energy use and increasing efficiency and sustainability. Improvements in membrane composition, selectivity and efficiency have been explored but more long-term testing and research needs to be done to effectively apply these advances. Understanding how advances in other technologies, such as renewable energy sources, can play into the desalinization process will reduce energy costs and reduce GHG emissions. Ideally alternative energies will become incorporated into such plants allowing for a freshwater source that is limitless and driven by renewable energy. Examining current desalinization plants can give us insight on the energy costs, feasibility, and the environmental and social impacts they might impose. This insight can help us become more efficient and sustainable for future generations.
3.8 Current Use
Since most desalinization plants are located in the Middle East, this makes it an exemplary place to observe how the previously discussed technologies are being implemented. Like the rest of the world, the Middle East is in dire need of freshwater. Landlocked and dominated by desert, a constant freshwater supply to fuel both population and industry is a mere mirage. Desalinization plants make living in the desert a possibility. Of the 7,500 desalinization plants in existence, almost 60% are located in the Middle East. In fact, Saudi Arabia holds about a quarter of the world's desalinization capacity, which provides 70% of the country's drinking water (Anon 2007).
The majority of the Middle East’s desalinization plants are located along the coasts; drawing water from the Arabian Sea, the Red Sea, and the Mediterranean Sea (Aquatech 2011). Countries like Israel and Egypt are extremely dependent on inland desalinization plants that pump and purify brackish groundwater to meet their industrial needs such as fracking and irrigation (Tal 2011). The majority of the plants are small, but the large plants are able to produce up to 150 million liters of usable water per day (Anon 2007).
Removing salt from seawater to meet freshwater standards is an extremely energy intensive process. Although brackish water (around 3,000-5,000ppm) requires less energy, saltwater desalinization takes between 2.8 and 9.8 megawatts of energy to produce 100,000 cubic meters of drinkable water per day (Anon 2007). Another qualm with desalinization plants is that they are powered by oil, natural gas, or coal. The most common desalinization technique, thermal distillation, is the most conventional in Middle Eastern countries. The problem, however, is that according to the World Wildlife Foundation, thermal distillation is responsible for producing the highest rate of greenhouse gases of all desalinization practices (Lindemann 2004). The “Sabha” desalinization plant uses 60 megawatts of energy per hour, and emits as much greenhouse gasses as a city of about 45,000 people, about the size of Bozeman (Tal 2011). To overcome the obvious shortcomings of traditional desalinization plants, governments and private agencies have been researching alternatives to the energy consuming hydrocarbon-powered plants.
Energy availability is not the only factor that can hinder the process of desalinization. A reliable source of brackish or saltwater is needed. Nearly half of Israel’s industry relies on brackish groundwater; the cost is half the price of desalinated Red Sea water, which costs 90 cents per cubic meter. Israel turned to desalinization plants in the 1950s to provide water for industry and agriculture. They started with traditional desalinization processes like thermal distillation, but after trial and error, the country’s first RO plant was established in 1973, neighboring a salty marsh. Israel’s infrequent and unreliable precipitation events combined with irrigation and desalinated water can interfere with agricultural successes in terms of productivity and yield (Tal 2011). Desalinated water is considered more pure than drinking water standards; however, the process of desalinization can leave the purified water with high amounts of bromide and boron, and remove essential minerals such as calcium. When Israeli farmers irrigated their crops with desalinated water, nutrient deficiencies in crops such as tomatoes, basil, and flowers appeared along with slight metal toxicities from the bromide and boron (Tal 2011). Pure desalinated water is also highly acidic and can be corrosive to pipes used in transporting the purified water off site. To mitigate the acidity, the water has to be mixed with outside sources of water that are adjusted for pH and hardness before being piped off site. During the desalination process, treatment plants must add chlorine to kill bacteria and then add a calcium compound such as lime to help control the chlorine levels in order to make it safe for consumptive use (Anon 2006). The unexpected negative effects of desalinated water on a valuable venture such as agriculture, caused agencies to take a closer look at the other impacts desalinization may be having on the environment.
Despite Israel’s strict conservation laws and policies, the ecological effects of desalinization refuse are unknown due to the infancy of the desalinization practices. The implementation of desalinization plants in coastal regions could pose a detriment to the water quality and ecosystems surrounding the infrastructure. So far, none of Israel’s private beaches have been sacrificed to build desalinization plants close to the sea.
3.9 Environmental Impacts and Mitigation
Depending on the desalinization process, the extent and nature of the byproducts will vary. Large quantities of hot brine, concentrated with residual pretreatment chemicals and heavy metals are discharged into the ocean. Brine solution and chemical discharges to the marine environment may have adverse effects on water and sediment quality, impairing marine life and the functional processes of coastal ecosystems (Höpner and Lattemann 2007). The current practice is to discard the brine directly back into the ocean, a process which alters the salinity, affecting turbidity and the density of the water. The brine from Israel’s desalinization plant, Sabha, is first diluted before being discharged back into the sea approximately 1km away from the plant itself. A 3% increase in salinity was found right next to the discharge site, however the gradient disappears after 3km (Tal 2011). The magnitude of the environmental impacts depends on environmental and hydro-geological factors, which are characteristics of the sea: bathymetry, waves, currents, and depth of the water column.
Though vast, and extremely dynamic, the ocean is a delicate aquatic system that is the principle component of the Earth’s hydrosphere and is integral to all life. Drawing from the open ocean can result in the loss of organisms through impingement as they collide with intake screens or are drawn directly into the plant. When organisms are drawn into the plant, intake pumps, screens, membranes, and plant operations are hindered. In order to reduce biofouling and scaling, various chemicals are used in the pretreatment and treatment of seawater.
Various mechanisms and procedures can be used to mitigate environmental impacts during the desalinization process. By locating intakes away from productive areas (deeper waters, offshore, or underground), the number of organisms lost to impingement and entrainment can be reduced (Höpner and Lattemann 2007). The environmentally favored subsurface intake is limited by geological constraints, however, this filters the saltwater upon arrival to the plant and alleviate organisms from being harmed. The most favorable hydrogeological condition for constructing subsurface intakes is highly permeable geological formations: sand, limestone, and gravel. A drawback to subsurface intakes is the lack of accessibility and the potential for the geological substrate to become fouled.
We must be conservative in exploiting the ocean as a solution to an overwhelming problem. The ocean is a finite resource that is in delicate balance. It is already in jeopardy of reaching a threshold. Disrupting a system that is the driving force and foundation to our planet could have detrimental effects. With the implementation of precise monitoring systems and imposing high effluent standards, creating a viable and sustainable desalinization infrastructure is feasible.
3.10 Future Use and Implementation
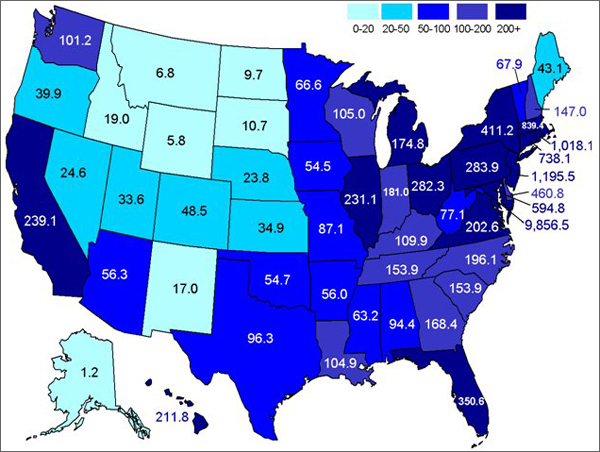
Figure 4. Population Density in America by state, per square mile (darker colors indicate higher population; US census data, 2010).
In the United States, we are fortunate enough to have easily accessible water for all. However, in particular parts of the country, the availability of water is becoming a problem and solutions need to be found. Southwestern United States is the most arid part of the country and has a large population, resulting in a high water demand from other regions of the country. Because of this, desalinization plants have been and are currently being built in the region. A plant in Santa Barbara was built in 1991 in response to extreme drought situations, but due to extremely high operating costs, it is not currently in use (Desalination 2013). The plant is in long-term storage and will be the last water supply to be utilized in the area in the case of a prolonged drought (Desalination 2013). This technology is currently very energy intensive, which is why more research needs to be done regarding coupled systems that group energy production and desalinization into one facility. There is a high amount of incoming solar radiation in southern California, making it an ideal spot for a solar-powered desalinization plant. Building these plants on the coast relieves the demand of inland freshwater reservoirs such as the Colorado River, Lake Powell, and other precious water storages that are rapidly being depleted.
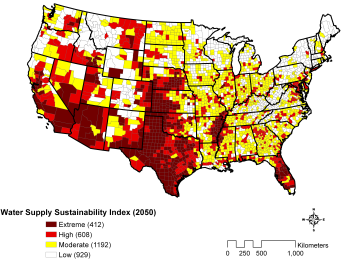
Figure 5. Counties shown in dark red are at risk of water shortage by 2050. (Map courtesy of Tetra Tech)
However, the Southwest is not the only place with water demands. The Southeast also suffers from water shortages, due to the booming population in the region (Seager et al. 2009). Figure 4 shows the population densities, per square mile, by state. As shown, it is clear that this region could benefit from desalinization plants. Constructing plants along the southeastern coasts would alleviate the need to divert rivers and deplete aquifers. A plant was constructed in Tampa Bay, Florida in 2007 to contribute freshwater to the ever-growing water demand in the area (Tampa Bay 2010). It currently provides 25 million gallons of freshwater to the area, which is equivalent to 10% of the area’s water needs (Tampa Bay 2010). If more of the southeastern states could replicate the success of Florida’s desalinization plant, then perhaps regional water crisis could be somewhat alleviated.
The future water demands by county are illustrated in Figure 5, showing that most of the areas of extreme scarcity are located near the coasts. If freshwater is provided for the majority of the population, then morecentralized US locations could focus on other water treatment techniques. The world is facing a water crisis, and we need to provide populations with clean, accessible water. Desalinization may be a great start to providing that need, however more efficient water usage must accompany this as well. Desalinization is only a solution for areas in close proximity to brackish or saline water, it is a localized solution to a localized problem. More efficient wastewater recycling, for example, could be a solution to the localized problem in the more central areas of the US.
4.0 Wastewater Treatment and Reuse
4.1 Introduction
Water scarcity demands an increase in water management efficiency and alternative, sustainable water sources. One such source is wastewater, which is water whose quality has been negatively affected by human use. Wastewater is often regarded as a burden, and its disposal has caused environmental, financial and managerial issues (Ghosh 2013). Wastewater management issues will become more pronounced with global population growth. Using wastewater as a water and nutrient resource could provide a sustainable solution to the problem of water scarcity, climate change and population growth.
Sources of wastewater include domestic, industrial, agricultural and urban runoff (UNEP and Global Environment Centre Foundation 2004). Domestic wastewater consists of two categories: black water, which contains human waste; and gray water, which is wastewater from the kitchen, baths, and laundry (World Health Organization 2006). Urban runoff is water that picks up contaminants and sediment as it travels over impervious surfaces. Finally, agricultural wastewater consists of irrigation water that does not infiltrate the soil and runs off the croplands. All of these sources can be treated and utilized in various ways.
The major applications of treated wastewater include irrigation, residential use (garden/lawn irrigation, car washing, toilet flushing, etc.), industrial use, and public use (street cleaning, fire-fighting, fountains, etc.). Although most wastewater must first go through a wastewater treatment facility, studies have explored the possibilities of on-site treatment and reuse of gray water on a domestic scale (Friedler et al. 2005). Domestic gray water reuse can eliminate unnecessary treatment costs, and improve use efficiency on a local scale. Globally, the largest wastewater use is irrigation, especially in developing countries where wastewater is the only affordable and reliable source of irrigation water (UNEP and Global Environment Centre Foundation 2004). Studies on the safety, benefits, and concerns of wastewater irrigation have shown that risks exist, such as contamination of soil and food crops as well as health risks to the farmers (Raschid-Sally and Jayakody 2008). Because of the large volume of water used globally for irrigation and the need for more food with a growing population, wastewater irrigation is likely the most important use of wastewater.
Most wastewater uses will involve exposing the public to recycled wastewater. Thus, clear policies and guidelines must be implemented to protect public health. The World Health Organization and the U.S. Environmental Protection Agency provide guidelines and standards for safe reclaimed wastewater (World Health Organization 2006, U.S. EPA 1992). These guidelines vary for different wastewater uses, but all require primary and secondary treatment. Primary treatment involves letting the water settle so solids and oils can be removed. Secondary treatment uses microorganisms to remove dissolved and suspended matter. After these two steps, further tertiary methods can be performed to disinfect the water. In many developing countries, farmers are using untreated wastewater for irrigation because of the expense of treatment (van der Hoek 2002 et al., Scott et al. 2000). Studies done in Pakistan have found that despite the benefits of using untreated wastewater for irrigation, there are negative health impacts incurred by the farmers from pathogens in the water (van der Hoek et al. 2002). In the U.S., guidelines vary by state, but a certain extent of treatment is required nationwide to reduce the health risk to farmers (McKenzie 2004). More focus on policy and public safety is necessary for the successful utilization of wastewater at all scales (Salgot et al. 2006).
In this section, treatment, reclamation technologies, and use of wastewater for a variety of applications will be discussed. Technologies involving on-site treatment and domestic reuse of gray water as an alternative to traditional water treatment will be explored. The current system of wastewater treatment will also be explained, as well as technologies for reclamation of treated water for reuse. Finally, the current use and possibilities of wastewater for irrigation will be elaborated. The nutrient content of wastewater should not be ignored, not only in places that are currently facing water stress, but also in areas that are predicted to face water scarcity in the future.
4.2 Gray Wastewater Reuse
In addition to the installation of water saving faucets, appliances, and general conscientious use, another way to conserve water is through gray water reuse. Gray water accounts for 50 to 80% of household wastewater, and averages 90-120 liters per person per day in developed countries. This water contains low levels of pathogens and nitrogen. With a little treatment, gray water can be reused for window cleaning, laundry, car washing, fire protection, boiler feed water, and toilet flushing. It can be used for lawn, garden, and crop irrigation as well(Li et al. 2009).Gray water reuse begins with the installation of a dual distribution and catchment system that keeps potable water, gray water, and black water separate. The source of the gray water dictates when and how it should be treated. For example, gray water from washing machines, bathroom sinks, and shower/tub drains can be used for irrigation with minimal treatment, if biodegradable soaps and cleaning products are strictly used. If non-biodegradable soaps and cleaning products are used, or if gray water from kitchen sinks is included, then more intensive treatment is required. Treatment usually includes a sedimentation step that can precede or follow treatment by physical, chemical, and/or biological means, depending on the source and contaminants present. The water is then disinfected and ready for non-potable uses, decreasing freshwater demand.
Physical treatment of gray water is done by filtration through coarse sand or soil, or through a membrane. Physical treatment usually must be coupled with another chemical or biological treatment, as filtration does not adequately remove organics, nutrients, and chemicals. Chemical treatments include coagulation, photo-catalytic oxidation, ion exchange, and granular activated carbon. When combined with a filtration and/or disinfection step, these treatments produce gray water acceptable for unrestricted non-potable uses. Biological treatment is the most varied, with treatment methods ranging from rotating biological contactor, sequencing batch reactor, constructed wetland, and membrane bioreactors (MBR; Li et al. 2009). All of these processes use microorganisms to break down the contaminants, but are only feasible on larger scales such as commercial facilities, industrial facilities or in urban residential buildings with a large number of inhabitants. All biological treatments except MBR also require a physical treatment as a polishing step before disinfection.
Once treated, stored gray water is plumbed through a dual distribution system to fixtures accepting of gray water, i.e. toilets, boiler feed, irrigation systems, etc. This dual distribution is necessary to keep potable water and gray water separate (Kang and Lansey 2012). Implementation of these systems in new structures, especially in large residential complexes, has low associated costs and many benefits, which will continue to increase as water becomes scarcer. A study of a new 5,000-inhabitant settlement in Berlin, Germany showed that the cost of using a dual distribution system would only be 3.9% more per capita over a 50-year period (Laflamme et al. 2011). Despite this initial economic investment, dual distribution systems should garner increasing attention in the future.
4.3 Black Wastewater Reuse
Unlike gray water, which has the possibility for on-site reclamation and reuse, black wastewater must go through more intensive treatment. This treatment usually happens at a centralized wastewater treatment plant. As wastewater enters a treatment facility, the first of many walls is preliminary treatment. This process is more of a precautionary step used to ensure the stability of the wastewater treatment plant. This step removes all large debris, from plastic bottles to action figures, which could possibly damage the pumps, tanks, screens and other processes further down the treatment path (Wastewater Treatment Methods and Disposal 2009). Racks, bar-screens, and comminuting devices accomplish this task. Racks and bar screens are inserted into the tanks, ¾ to 6 inches apart, at an acute angle from the influent stream. The angle more waste material to build on the screens, which can be collected manually or mechanically by means of a rake. The waste is disposed of through incineration, hauled away to a landfill and buried, or added to a comminuting device (Basic Information about Bar Screens 2009). Comminuting devices break down large organic matter and other debris, through cutting, shredding, and grinding actions. Another strategy often employed by wastewater treatment plants is the addition of grit chambers. These chambers allow for heavy unwanted gritty material like sand and gravel to be removed. In these chambers, the velocity of water flow is reduced significantly so that the heavy material sinks to the bottom, while the lighter organic matter will remain in suspension (Wastewater Treatment Methods and Disposal 2009). These devices prevent possible damages due to abrasion or clogging.
After large debris is removed from the system, the wastewater moves onto the primary stage, where organic and inorganic solids are removed by physical means. In this stage, wastewater passes through a series of tanks where the particles settle out. This process should take about 2-3 hours, but is dependent on water temperature and purity. When water temperature decreases, it becomes denser; therefore more time is required for particulates to settle out of a sedimentation tank. Particulates from wastewater either float to the surface or sink to the bottom (Wastewater Treatment Methods and Disposal 2009). Many of the substances in these tanks will coagulate and float to the surface with the addition of air through the bottom of the tank. These particulates are collected in a trough at one end of the tank and the waste material that sinks to the bottom is pushed into a collection chamber, either in the middle of the tank or at one end (Wason et al. 2007).
Another device is an Imhoff tank, a newer version of the common septic tank that requires very little maintenance and has no mechanical equipment. These tanks are set up with two chambers, one directly above the other. Sedimentation occurs in the upper chamber, and the sediments pass to the lower chamber through a small opening. Sludge forms in the lower chamber as a result, and anaerobic digestion breaks down the sludge. Many of these tanks also contain a rock-bed filter that houses more digesters, which feed and treat the effluent even further (Indah Water 2013). It is possible that after this stage the effluent could be released into receiving water, however, nutrient levels are usually still very high and further processing is required to meet EPA standards. In Malaysia these tanks account for about 24% of all sewage treatment plants, but are only a short-term solution to an ever-growing water quality problem, being that they are only part of the primary treatment stage.
In the secondary phase of wastewater treatment, microorganisms are used to break down organics in the water. With a trickling filter, a film of microorganisms grows and feed on the wastewater that passes over these fixed surfaces. The wastewater promotes the growth of bacteria and protozoa, which also causes the slime layer to grow thicker over time. As the slime layer grows, it becomes more difficult for oxygen to enter the system, but also allows for anaerobic processes to occur near the surface of the slime media, breaking the waste down further (Wastewater Treatment Methods and Disposal 2009). Wastewater treatment plants function as bacteria farms, with their main food source being oxygen and organic matter from wastewater. These excess bacteria from this system create a sludge, which can be used as a fertilizer and disposed of on land (EPA 2013).
Stabilization ponds are also used to biologically treat wastewater in secondary treatment. These systems rely on the natural aerobic and anaerobic processes carried out by algae and bacteria, as well as decomposition reactions from sunlight. These ponds have extremely low energy requirements, bio-energy generation (methane), and almost no usage of chemicals or electricity (Shilton 2008). In most mechanical ponds, aeration is the most energy intensive process, taking 62-85% of the electrical energy the plant requires. The growing algae obtain energy from sunlight and can produce all the oxygen needed by bacteria to remove the organic matter (Shilton 2008). Both bacteria and algae feed on and break down the waste material in an aerobic environment. Just below the surface, bacteria also break down settled organic debris through anaerobic processes (Wastewater Treatment Methods and Disposal 2009). Utilizing natural systems is often the most affordable and most efficient method for water treatment. No extra chemicals need to be added to the system and the process is based solely on biological processes. In a study conducted in Birjand, Iran, mechanical ponds were capable of removing approximately 76% of organic debris. Increased retention time and a higher temperature result in a greater removal of organic waste (Ehsan et al. 2013).
Following these treatments, discharged water can be used differently. In some cases the water can be circulated back through the treatment process for an even more thorough removal of organic matter. Another option involves more advanced methods, which are, in most cases, extensions and combinations of biological and chemical systems to remove nutrients like nitrogen and phosphorous, making it safe to drink (EPA 2013). To address water scarcity, many treatment plants are looking to reclaim secondary effluents for reuse.
4.4 Effluent Reclamation Technologies
With secondary effluents being such a potentially valuable resource, reclamation of this water is essential. The water and nutrients of reclaimed wastewater are being utilized in many countries for crop irrigation (Rojas-Valencia et al. 2011). While it is important to keep in mind that raw wastewater can vary tremendously depending on location, pathogenic contamination is an issue (Agullo-Barcelo et al. 2013). Using water contaminated with microbes that are harmful to humans may make the irrigated crop unsuitable for sale and consumption. According to the World Health Organization, unrestricted irrigation requires that wastewater contain less than 1,000 fecal coliforms per 100mL (Bichai et al. 2012), but in the USA the EPA guidelines vary between states and are usually more conservative (Norton-Brandao et al. 2013).
There are multiple ways to decontaminate wastewater for irrigation so that otherwise released effluent is used efficiently. Ozonation can make wastewater suitable for irrigation by destroying the cell walls of microorganisms and solubilizing or oxidizing them to organic substances (von Guten 2007). Also, the hydroxyl radicals that are spontaneously produced are capable of degrading pharmaceuticals and biocides (Margot et al. 2013). Ozone-treated wastewater used for irrigation has the ability to oxygenate and increase nutrient content of soils (Rojas-Valencia et al. 2011). Depending on oxidative need, most wastewater is treated with a dose of 2-13mg O3 /L (Rojas-Valencia et al. 2011, Margot et al. 2013). In a study by Rojas-Valencia et al., approximately 60L of irrigation water was produced in 1 hour. In addition, the process only used 1.2x10⁻⁶ kWh/L of power. In the study by Margot et al., a 129,000L reactor was treated for 20-60min. The average electricity consumption was 0.117 kWh/L. Energy cost of ozonation in the Rojas-Valencia et al. study is approximately $3 per month for a possible 4,3200L ($6.9x10⁻⁵/L). In the Margot et al. study, energy costs were approximately $830 for the 129,000L ($0.0064/L) of water treated in one tank. It appears that ozonation on a smaller scale is more cost efficient, but not as effective in providing global or even regional irrigation needs. Ozone technology in general has moderate operating costs and high investment costs compared to other disinfection technologies (Norton-Brandao et al. 2013).
Solar disinfection is a process that is gaining some attention as an option to reclaim wastewater for irrigation. There are multiple disinfection techniques involving solar radiation including the titanium oxide and photo-Fenton methods (Agulló-Barceló et al. 2013). The hydrogen peroxide (H2O2) method has the least associated risk due to its high volatility. Usually between 5-50mg H2O2/ L is added to the wastewater in the compound parabolic collection reactors (CPCs) (Bichai et al. 2012, Barcelo 2013). Hydrogen peroxide and sunlight have been effective for water disinfection against bacterial cells and fungal spores by the oxidative action and DNA mutations provoked by UVA photons (Bichai et al. 2012). The solar reactors in the studies by Agulló-Barceló et al. and Bichai et al. did not use any electrical energy, which is an advantage over ozonation. On the other hand, Bichai et al. treated 20L in five hours or less. The reactors in the study by Argullo-Barcelo et al. were only 10L with a flow rate of 10L/min, meaning 300L of water was treated in 5 hours. Although solar methods sound promising, sunny days are needed for the process to be viable source of irrigation water. Solar-radiation disinfection methods provide a low cost method for wastewater treatment because they do not involve electricity and CPCs can be made from relatively inexpensive materials. The approximate cost to build a 25L CPC was about $200, which dropped the price of water per liter to $0.002/L (Ubomba-Jaswa 2010). It is important to keep in mind the practicality of the solardisinfection method in that CPCs treat relatively small amounts of water. This method may only be cost effective in domestic situations with the current designs.
4.5 Irrigation with Wastewater
Agriculture's high water demands may be lessened by using reclaimed wastewater. Irrigation with wastewater presents many benefits. Secondary effluents contain elevated levels of macronutrients and organic matter that can change pH, buffer soils, or act as fertilizer. If proper care is taken to minimize microbial contamination and heavy metal content, wastewater irrigation will conserve freshwater supplies.
In one study, sewage sludge was equivalent to adding 3.27g of NH4 and 4.33mg of NO3 per square meter when irrigating lawns (Fangueiro 2013). Applying wastewater yielded taller grass heights and a net increase of organic matter to the soil. Additionally, soil pH increased when treated sludge wastewater was applied, due to the alkaline pH of the wastewater. Wastewater irrigation maintains cation concentrations in soil as well. In a study conducted in Vietnam, wastewater reuse provided 16% of the irrigation of the rice crop, while providing 22% N and 14% P requirements and reducing pollution to streams and canals (Trinh 2013). While, in most cases, wastewater cannot provide all of a crop's nutrient needs, it does serve to reduce the amount of synthetic fertilizer application and thus production costs.
Secondary effluent, while containing elevated pH, EC, heavy metals, and nutrient levels, is an invaluable water source in arid and semi-arid landscapes. A major concern is contamination with human pathogens. Effluent contains E. coli, faecal coliforms, and many other microbial pathogens. The concern is greatest for crops that are consumed raw. Castro et al. (2013) found that microbial populations are sensitive to additions of water and the source of this water; switching from wastewater to drinking water decreased bacterial concentrations. Sub-surface and drip irrigation systems separate the harvested/consumed crop from the wastewater while increasing efficiency; however, these irrigation systems are expensive. The season during which irrigation is applied is an important factor in the severity of microbial contamination. Many researchers suggest that increased sunlight is key to reduce coliform populations and water that will be used for irrigation should undergo solar treatment. The World Health Organization (2006) has suggested guidelines for microbial population levels.
Another concern with the use of sewage sludge is the accumulation of heavy metals. Sludge contains elevated levels of metals and their low mobility in soils makes accumulation rapid (van Oort et al. 2008). Further treatment methods exist to remove these metals; if metals are not removed, the effluent should not be used. Metal contamination not only has a negative influence on plant health, but iron, manganese, and zinc accumulate in some crops (Kalavrouziotis et al. 2009).
Not all water or water treatment plants are appropriate for the production of water for irrigation. An Italian study (Burbagallo 2012) determined that a treatment plant needs to support more than 5,000 people, exist 50m or greater in elevation than the nearest irrigation district, and in close proximity (within 15 km if the plant's discharge is greater than 30 liters per second). These considerations should be made when planning the construction of new treatment plants. Ultimately, it must be economical to treat and transport the treated water.
The benefit of wastewater irrigation is a nutrient-rich alternative water source for agriculture. Despite possible advantages, degraded water quality, and distant treatment plant locations can render water unusable. However, given current and future water shortages, areas where wastewater can be used for irrigation possess a distinct advantage.
4.6 Conclusions and Applications
It is clear that there is not a cure-all to global water scarcity, but an integrated and diversified approach may be the first step to a solution. Proper wastewater management has the potential to change how the world manages water resources, especially when it comes to agriculture. Further development and wider implementation of gray water reuse systems are good ways to conserve water before it even enters the wastewater stream. Implementing policies or subsidies for installing these reuse systems would be a viable option for governments and nations facing water limitations, because reusing gray water would dramatically reduce the demand of freshwater in urban and residential areas. This would free up water resources for more important uses such as agriculture.
Primary and secondary wastewater treatments are very efficient in removing the organic waste and large debris from black water. With physical methods, the large debris, including floating and sinking solids can be collected and removed. Other natural methods include aerobic and anaerobic processes that utilize algae and bacteria, which can be used to break down and remove the rest of the organic matter from the effluent. The outgoing water can then be used in some irrigation processes or can be further treated to remove any excess nutrients, making it safe to return to freshwater systems.
The technologies that exist for treating wastewater to irrigation standards are relatively undeveloped or underutilized. More research needs to be done to make these treatments more efficient and cost effective. Research in treated wastewater used for irrigation shows promising results in small-scale situations such as upcoming urban agriculture systems (Rojas-Valencia et al. 2011), but scaling up to major production farming may be more problematic. Also, some of these treatment technologies are only viable in specific places as is the case with solar-radiation disinfection. Solar disinfection would not pertain to areas that do not receive an adequate amount of radiation. Efforts need to be focused into bettering wastewater treatment technology (efficiency and costs) as well as identifying the logistics of shifting usage of these technologies to larger scales.
The fate of water after its first use is usually extensive treatment in a plant. In agricultural areas, some of this otherwise unsuitable water can be used to subsidize irrigation water supplies. It serves many beneficial uses and can improve soil qualities. With careful monitoring, wastewater irrigation could alleviate pressures on our increasingly limiting water supplies.
5.0 Water Use Efficiency
5.1 Water Use in Agriculture
The world’s biggest user of freshwater resources is agriculture, accounting for 70% of freshwater allocation (United Nations: Food and Agricultural Commodities Production 2013). The increasing scarcity of water threatens much of the agricultural community and the people that depend on the food and jobs it provides. This is compounded by the predicted increase in population, which will require agriculture to double its production by 2050 in order to accommodate 2 billion more people and changing diets (Chartres and Varma 2011). The increase in the production of agricultural goods will require more water to meet the demand.
In the United States, as much as 85% of the fresh water is used for agricultural purposes (USDA 2006, Chartes and Varma 2011). Aquifers play an especially large role in irrigation, as 60% of U. S. agriculture depends on groundwater (Scanlon 2012). Massive amounts of water are used during the production of agricultural goods. It takes 1,799 gallons of water to produce one pound of grain fed beef and 132 gallons of water to grow one pound of wheat (Mekonnen and Hoekstra 2010). China produces around 201 million metric tons of rice per year and each ton takes close to 1 billion gallons of water to produce (Chartres and Varma 2010).
There are many inefficient water uses within agriculture such as commercial farming and over application of water through irrigation. Conventional or commercial farming techniques are water inefficient because the soil is constantly being broken up with tillage (Ram et al. 2013). In exposed clumps of soil, moisture is vulnerable to evaporation instead of being held in the soil. Water is lost more quickly and is available to plants for a shorter amount of time (Ram et al. 2013). Throughout the world, especially in commercial farming, over application of water is common; over-watering of crops presents itself as the easiest solution to increasing yields (Muir 2012). Besides being an inefficient use of water, over-irrigation can increase soil erosion due to runoff, leaching of nutrients and chemicals, and build up of salts (EPA 2012).
Efforts worldwide need to be made to manage crop irrigation more efficiently. Methods such as efficient management of irrigation and planting crops that require less water can help bring down the total water use. This is crucial since many sources for freshwater are disappearing and the effects of climate change could impact that availability even further. Essentially there needs to be more crop per drop.
One possible solution to counter inefficiency is to increase the soil’s ability to hold water for longer periods of time. This can be done through conservation farming, a term used to describe any method which aims to conserve soil and water by using surface cover to minimize runoff, erosion, and improve the conditions for plant establishment and growth (O’Gara 2010). It involves planting both crops and pastures directly into the soil, which has a surface cover as a result of using minimum or no-tillage techniques (O’Gara 2010). The reason that this is a water efficient management method is because low tillage and no tillage methods increase the soil’s water holding capacity thus decreasing the need for extra irrigation.
The downfall of all irrigation is that additional water must be applied to account for irrigation inefficiencies so that the desired amount reaches the plant. Only 70 - 80% of the water applied through irrigation actually reaches and can be used by the crop (Jones 2004). Due to this inefficiency, determining the amount of water a crop needs without over application is important and can be done through irrigation scheduling. Irrigation scheduling uses water management strategies to prevent over application while minimizing yield loss due to water shortage or drought stress (Evans et al. 1996). Extensive knowledge of the soil type, soil water holding capacity, local environmental conditions, crop stress, and water demands of the crop is required. The amount of water a crop needs for optimum production can be accurately calculated. For example, under average conditions, small grains, like wheat or barley, will need between 14 and 16 inches of soil moisture per growing season, depending on climatic conditions and the length of the growing season (McMullen 2003). With knowledge like this farmers can properly schedule the amount of irrigation in order to maximize water efficiency and crop yields. According to the USDA (2006), 160 billion gallons of water per year is saved in America due to irrigation scheduling.
Water efficiency in agriculture is more important now than ever due to water scarcity. Inefficient water use does not have to be such a large problem when armed with the right management approach. There are many agricultural methods and technological advances that are already being implemented throughout the world. Conservation farming techniques and irrigation scheduling are just a few water efficient methods available that can help decrease inefficient water use in agriculture. The management of surface water resources is also a crucial aspect of preventing inefficiencies in agriculture.
5.2 Approaching Water Scarcity in Bozeman, Montana
Bozeman’s current population is over 38,000 residents. If the city continues to grow at a 2% rate, the population could top 70,000 in 30 years and will be over 90,000 by 2042 (City of Bozeman, MT 2013). Unfortunately the current water infrastructure can only support the water demands of about 50,000 people (Swearingen 2012). A water crisis is quickly approaching because the city expects to reach this population in the next 10-15 years. The fast growth of Bozeman means that city planners need more water, however where that water will come from is a contentious issue.
The upper Missouri drainage in which Gallatin County is located is a closed basin. The term “closed basin” refers to all the surface water rights in the valley already being claimed (Swearingen 2012). On April 16, 1993, Montana declared this drainage a Legislative closure and precluded permit applications for new appropriations and requests for state water reservations (DNRC 2003). There are still exceptions in which the Department of Natural Resources may permit applications to appropriate groundwater and to store water during high flow conditions (DNRC 2003). These issues, along with others, led Bozeman city leaders to develop the Integrated Water Resource Plan (IWRP) in hopes of meeting Bozeman’s future water demands.
IWRP was finalized in 2012 by a committee for the City of Bozeman to evaluate water conservation opportunities, foresee existing water rights and future purchasing, and express opportunities to develop new water resources. The IWRP is appointed and constructed by the Technical Advisory Committee (TAC) made up of experts eager to assist in the research and possible future development to ensure a sufficient water supply for Bozeman’s community for the next 50+ years (City of Bozeman, MT 2013).
The TAC developed five categories of criteria within the planning process in relation to the values of the people of Bozeman. The following categories were then used for finalizing the plan (in order of weighted percentage): environmental (28%), water supply (22%), economic (19%), technical (18%), and social (13%) criteria. These percentages were determined not only by the community’s values but by factors such as energy use, disruption to aquatic and terrestrial systems, and resilience to climate change (City of Bozeman, MT 2013).
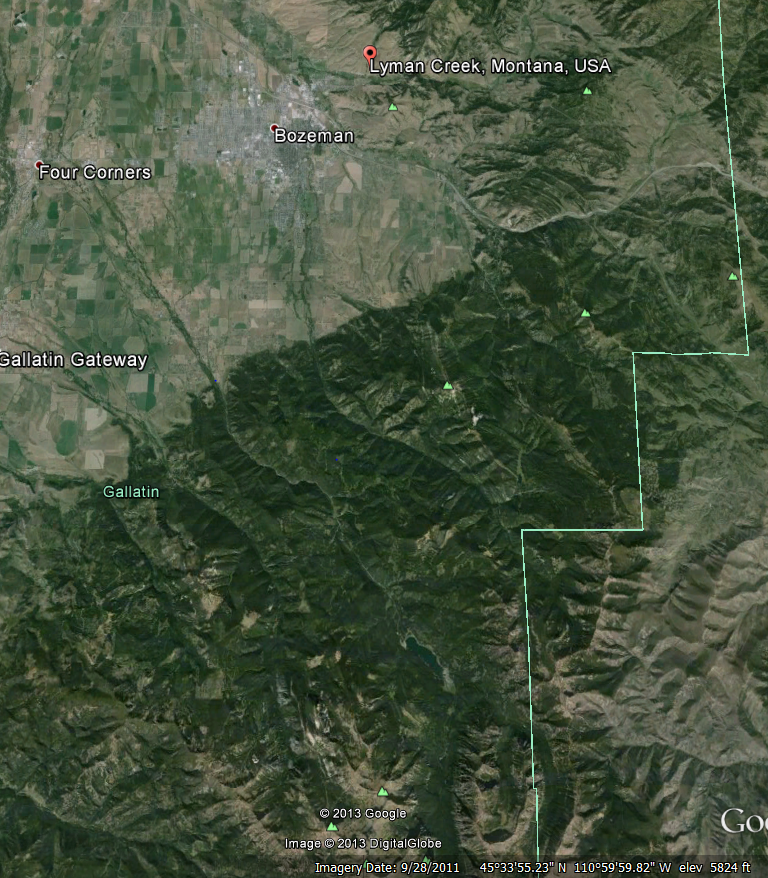
Figure 6. Map showing Lyman Creek, Bozeman to and Sourdough Impoundment. (Google Maps)
In order to meet the future water needs, terms were constructed for the city to be active in water conservation measures. In the next year, consumer-education programs, incentives for changing out water-wasting fixtures, and monitoring of less conventional water-saving measures are actions that will be cost effective. An ongoing effort to acquire additional shares from willing-seller shareholders in the Hyalite Reservoir will also be implemented by the city in the near future. An intermediate term incentive proposed would involve a cost/engineering/legal feasibility study in order to determine how water production from Lyman Creek source can be more optimized. According to data collected in the IWRP, Bozeman holds a much larger water right than what is currently being used from the Lyman Creek water source (City of Bozeman, MT 2013). In the longer term, the construction of one or more impoundments on Sourdough Creek above the treatment plant may be implemented (Figure 6). Not only would this take advantage of the city’s water rights and water reservation, but it may raise the height of Hyalite Dam an additional 2,784 ac-ft. of water for municipal uses. Another measure suggested is a site and development of a new well field above the existing Bozeman Water Treatment Plant in Sourdough Canyon to supply the city with groundwater from the Madison Aquifer (City of Bozeman, MT 2013).
The current Sourdough Impoundment planning document proposes a 6,000 ac-ft. dam that could serve approximately 90,000 people excluding any new large industrial water users. The construction of a new impoundment alternative may be controversial due to legal challenges that could be faced between environmentalists, farmers with current water rights for irrigation, and a Great Falls power company that is a significant user of the canyon. Within the community of Bozeman, Sourdough Creek Canyon is highly valued for recreational use, resulting in resentment towards this alternative. Public involvement is weighted towards conservation and evaluation of other resources. Peter Skidmore, President of the Greater Gallatin Watershed Council (TAC member), believes that great achievements can be made, “…with conservation measures and integrated utility measures, without having to go to some big, new infrastructure development” (Swearingen 2012). Not only would this be the cheapest way to go, but it would conserve water and reduce the rate of demand that Bozeman faces in the future.
Withdrawal of water from the Madison Aquifer is also an alternative possibility for supplying more water for the City of Bozeman’s growing population. The Madison Aquifer is part of the Madison Limestone rock formation that extends beneath 8 states. This possibility would involve well drilling at a minimum of 460ft to over 2000ft near Mystic Lake in order to determine the extent of the aquifer. Well drilling is resilient to drought, impervious to wildfire, and would require less treatment than surface water. Economic implications are difficult to predict without having more information on quality, quantity, and physical characteristics of water supply (City of Bozeman, MT 2013).
In order to reduce or delay the expenditure of millions of taxpayer dollars and destruction of recreational values, small measures can be taken by the city, local businesses, and residents. Actions towards water conservation each day will benefit the growing population of Bozeman and along with its increasing water demand.
5.3 Water Use Reduction Example: Montana State University – Bozeman
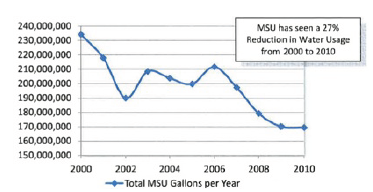
FIgure 7. MSU water use from 2000-2010. (City of Bozeman, MT 2013)
An example of the application of water-saving measures is the water use of the Montana State University (MSU). If MSU stood alone with close to 15,000 students and 2,400 employees, it would be the 8th largest city in Montana (MSU Facilities Services). Like any city, it needs water. Water goes towards irrigating the 200 acres of landscape, flushing the approximately 650 toilets, and creating the steam that helps heat the campus, just to name a few. MSU’s water use in 2010 was 172 million gallons of potable city water and 76 million gallons of irrigation water (Butler 2011). The university owns and maintains 120 buildings as well its own primary electric, water/sewer, and natural gas distribution systems. MSU operates much like a city and makes a conscious effort to be more sustainable. New technology and infrastructure have helped save money as well as resources. Figure 7 shows the pattern of water use on campus since 2000 and illustrates an overall decline in water use since 2010. In a world that is facing a serious water crisis, water efficiency is going to be key, and MSU is a good example to follow.
Irrigation is one of the main uses of water on campus. MSU is not only beautiful because of its terrific views of the Bridger Mountains, it is also beautiful because of its green grass. Even with snow on the ground for the majority of the year, MSU irrigates for roughly 20 weeks. In 1983 the university began converting its irrigation system to one that uses non-potable surface water instead of treated water purchased from the city of Bozeman. The new system that is almost completely transformed to use non-potable water involves over 10,000 sprinkler heads, 1,000 sprinkler zones, and 100 irrigation clocks, all controlled by a centralized Maxicom system computer (MSU Facilities Services). This system is directly tied to a weather station, and water use efficiency is maximized by delivering and scheduling irrigation based on evapotranspiration rates. Watering during the evening and overnight occurs as much as possible, but some daytime irrigation is required because of the flow capacity of the system. Because of these system improvements, MSU saves about $110,000 annually, and more importantly, 24 million gallons of water (Hook 2013). As MSU continues to expand the distribution of non-potable water, even more savings will be seen. This is an example of one of the many ways MSU has become more efficient.
As buildings are renovated and remodeled, bathrooms are upgraded to low flush toilets and urinals. Upgraded urinals use a pint of water per flush, while toilets use 1.6 gallons per flush. Roughly 25% of bathrooms have been upgraded to low flush systems (Hook 2013). In addition, MSU continues to update heating and cooling systems. The steam that is used to heat campus buildings is part of a reclaim condensate system. In the process of generating steam, when it condenses completely an equal amount of condensate (distilled water), is formed (SpiraxSarco 2013). This can then be used again and again, resulting in tremendous water savings.
Reducing consumption and becoming more water efficient is important, but improving water quality and working to reduce water pollution is equally important. The many parking lots on campus collect pollutants, sediments, and litter. When it rains, those things get washed into the many creeks around Bozeman. On campus, the parking lot behind the field house has been redesigned to address this. Added green space and depressions filter the sediments and pollutants that would otherwise end up in Mandeville Creek (Hook 2013). In addition, the space has been vegetated with fescue, a native grass that requires less irrigation. Rain gardens have been established at the Horticulture Farm and the Plant Growth Center and landscaping around the new College of business building will include rain gardens. Rain gardens are planted in depressions and collect rainwater runoff. They take advantage of storm water, while highlighting native vegetation and helping to improve water quality (Hook 2013).
Last March MSU was chosen as one of the “Sustainable 16” in the Environmental March Madness Tournament, in part because of campus sustainability efforts (Boswell 2013). Students living in residence halls are reminded how to save energy and water throughout the year. In addition, there are numerous organizations on campus, such as the Campus Sustainability Advisory Council (CSAC) and the Network of Environmentally Conscious Organizations (NECO), that work to promote sustainability initiatives. MSU shows a continued effort to reduce water use. It not only implements new infrastructure and technology, but also works to educate. A water reduction plan has been initiated with the residence halls and food services, and facility personnel believe that sustaining a net zero footprint for water provided by the City of Bozeman could be achieved through the 2019 campus planning period (City of Bozeman, MT 2013). Because of a projected growth rate of 2% per year, additional water will be needed, but with new technology and increased efficiency, MSU could continue to see savings. There is always room for improvement, but MSU seems to be a good example of how to protect water resources.
5.4 Residential Use in the United States
While Montana State University is making strides to increase water use efficiency and has been recognized for its efforts, there is much room for improvement in our city as a whole. Annually in Bozeman, residents use an average of 624 liters of water per day, an amount higher than the American average of 575 daily liters per capita; however, in desert communities such as Phoenix, Arizona residential water use can reach quantities greater than 1000 daily liters per capita (City of Bozeman, MT 2013, Watkins 2006). Compare this number with 200-300 daily liters per capita, the amount the average European uses, or less than 10 daily liters for residents of Mozambique, Africa, an amount significantly below the water poverty line of 50 daily liters per capita (Watkins 2006). Considering these values are averages, some residents of Mozambique receive less than 10 daily liters per capita. As global populations continue to rise and the available supply of fresh water dwindles, our frivolous and consumptive water habits will prove unsustainable. The nearly free and readily available clean water access that we enjoy is rarely considered a luxury, but more of a right, and it’s something we must begin to think about critically. The eyes of the world are upon the United States, and this is a pivotal moment in which there can be a shift in the current water use paradigm, setting the stage as leaders in personal water use efficiency, or we can continue as the nation that wastes more water per person than any other on the planet. This change can easily begin at home by taking a look at our daily routines and recognizing inefficient habits, and evaluating simple solutions to dramatically increase efficiency.
There typically is a disconnect between how much water individuals believe they use and how much is actually consumed. The average American family of four can easily use 1514 liters of water per day, and of that 70% is used indoors. Using 13-26 liters per flush, toilets alone can account for 27% of the daily indoor residential consumption, followed by clothes washers at 22%, showers at 17%, faucets at 16%, and plumbing/appliance leaks accounting for 14%. If it’s difficult to imagine that your daily routine can account for so much individual water use, consider the fact that a faucet that has not been retrofitted to more efficient technology can run at 7.6 liters per minute, and if that is left open while doing dishes by hand, upwards of 76 liters may be used. An automatic dishwasher can consume between 102-204 liters (US EPA 2013). The next time you are standing beneath the warm spray of your showerhead, contemplate the fact that, by taking a 5 minute shower, more water is being used than the average person in a developing country slum uses for an entire day (Watkins 2006).
Simply because Americans consume so much water doesn't mean that individuals in developing countries receive less. The issue is that as those countries develop and gain access to fresh water, those citizens will desire the same comforts that Americans already enjoy. Now is the time for a fundamental paradigm shift in the way we use and think about water. In the U.S., personal responsibility needs to be taken for residential water use rather than continually demonstrating what not to do. Making a conscious effort to consider our water consumption habits is an excellent place to begin. Spending the money to retrofit appliances, faucets and shower heads in our homes to the latest energy saving technology, while effective, is only useful if behaviors are “upgraded” along with it, as people will tend to increase duration and frequency of use when they know they are using “water-saving” technology (Suero et al. 2012).
5.5 Residential Efforts to Lower Water Use
There are many simple steps to increase residential water efficiency. By making an effort to turn off the faucet while brushing teeth or shaving, an individual can save more than 760 liters of water each month. Choosing to scrape dishes rather than rinsing them before loading the dishwasher can save up to 38 liters of water per load. If dishes are done by hand, filling the sink or a bowl with soapy water and turning off the tap can save half of the 76 liters typically used (US EPA 2013). Residents of the City of Bozeman willing to invest money in increasing the efficiency of the toilets in their home are encouraged to do so with incentive. Beginning in 2008 the City of Bozeman initiated a program to provide residents with $125 for replacing pre-1996 toilets, and $50 for post-1996 toilets with high efficiency 4.8 liter per flush models (City of Bozeman, MT 2013). This incentive is only provided for a maximum of two rebates per household, but the water savings for each home is estimated at nearly 2000 liters per month (City of Bozeman, MT 2013).
Residential water consumption is something in which everyone participates. Responsible and efficient usage should take precedent immediately, as the population collectively addresses the inevitable water scarcity issues that will unfold in coming years. The United States can and should lead the change worldwide, and where better to start than in the comfort of our own homes?
6.0 Conclusion
There are many take home messages from this overview of water issues. Essentially we understand that water is a scarce resource in many places due to physical scarcity and pollution,and that these issues are likely to be exacerbated in the coming decades by climate change and population growth. However, there are solutions to address these challenges. First, water law and policy, despite having trouble keeping up with technology, are vital tools for the future of equitable and fair water use. Next, desalinization has the potential to be an applicable, efficient freshwater resource for the global population, yet still needs to become more energy efficient. Technological advances in membranes and coupling renewable energy sources with desalinization plants can move us in that direction. Additionally, wastewater reuse can provide a sustainable source of water to alleviate scarcity issues and a source of nutrients to reduce fertilizer inputs on agricultural lands. Furthermore, increasing water efficiency can be achieved through management practices, water conservation, and technology. The essential message is that adaptive management and innovative application of technology can help us meet critical future water needs.
7.0 References
Aintablian, X. W. 2011. Water Desalination. Accessed 16 October 2013. www.about.com
Agulló-Barceló, M. M., M. I. Polo-López, F.F. Lucena, J.J. Jofre, and P.P. Fernández-Ibáñez. 2013. Solar advanced oxidation processes as disinfection tertiary treatments for real wastewater: Implications for water reclamation. Applied Catalysis B: Environmental. 136-137: 341-350.
Alabama State Water Program. 1998. Accessed 26 November 2013. http://www.aces.edu/waterquality/glossary/glossary_results.php3?rowid=829.
Alberta. 2001. An introduction to wind erosion control, agriculture and rural dept. Accessed 15 November 2013. http://www1.agric.gov.ab.ca/$department/deptdocs.nsf/all/agdex3524.
Anon. 2002. Federal Water Pollution Control Act. US EPA 1-234. Accessed 8 October 2013. www2.epa.gov/laws-regulations/summary-clean-water-act.
Anon. 2006. What is desalinated Water? Accessed 16 November 2013. www.DesalinatedWater.org.uk.
Anon. 2007. Middle East goes nuclear for water desalination plants. Next Energy News.Accessed 6 October 2013. http://www.nextenergynews.com/news1/nextnews9.17a.html.
Anon. 2009. Desalination and energy. Water Secure March 31. Accessed 15 October 2013. www.watersecure.com.au/pub/what-we-do/desalination-and-energy.
Anon. 2011. Aquatech secures Middle East desalination project. Pump Industry Analyst 6: 3-4.
Anon. 2013. History of the Clean Water Act. US EPA. Accessed 15 Oct. 2013. http://www2.epa.gov/laws-regulations/history-clean-water-act.
Barbagallo, S., G. Cirelli, S. Consoli, F. Licciardello, A. Marzo, and A. Toscano. 2012. Analysis of treated wastewater reuse potential for irrigation in Sicily. Water Science and Technology. 65: 2024-2033.
Basic Information about Bar Screens. 2009. Bar Screens. Accessed 6 October 2013. http://www.infobarscreens.com/.
Bichai, F., M. Polo-López, and P. Fernández Ibañez. 2012. Solar disinfection of wastewater to reduce contamination of lettuce crops by Escherichia coli in reclaimed water irrigation. Water Research. 46: 6040-6050.
Boswell, E. 2013. MSU's commitment to environment places it in top 16 in March Madness Tournament. MSU News Service. Accessed 21 October 2013. http://www.montana.edu/news/11749/msu-scommitment-to-environment places-it-in-top-16-in-march-madness-tournament.
Butler, Jeff. 2011. Facilities Services overview and discussion. Accessed 21 October 2013. http://www.montana.edu/us/files/FSOD2011.pdf.
Campbell-Mohn, C., B. Breen, J. W. Futrell. 1993. Sustainable Environmental Law: Integrating Natural Resources and Pollution Abatement Law from Resources to Recovery. West Publishing Co., St. Paul, MN.
Castro, E., P. Mañas, and J. De Las Heras. 2013. Effects of wastewater irrigation in soil properties and horticultural crop (Lactuca sativa L.). Journal of Plant Nutrition. 36: 1659-1677.
Chartres, C., and S. Varma. 2011. Out of Water: From Abundance to Scarcity and How to Solve the World's Water Problems. FT Press, Upper Saddle River, NJ, USA.
City of Bozeman, MT. 2000. IWRP Water Conservation Plan Technical Memorandum. Annual MSU water use from 2000 to 2010. pp. 7-9.
City of Bozeman, MT 2013. IWRP Alternatives: WSD1 Sourdough Reservoir and WSD3A Madison Aquifer Groundwater. pp. 2-6, 134-141.
City of Santa Barbara. 2013. Desalination. Accessed 16 October 2013. http://www.santabarbaraca.gov/gov/depts/pw/resources/system/sources/desalination.asp
Coggins, G.C., C. F. Wilkinson, and J. D. Leshy. 2007. Federal Public Land and Resource Law. Foundation Press, New York, New York.
Cubic Yards Converter. 2013. Traditional Oven. Concrete Conversion. Accessed 10 October 2013. http://www.traditionaloven.com/building/masonry/concrete/convert-cubic-foot-cu-ft-concrete-tocubic-yard-cu-yd-concrete.html.
Davis, J. R., and K. Koop. 2006. Eutrophication in Australian rivers, reservoirs and estuaries – A southern hemisphere perspective on the science and its implications. Hydrobiologia. 559: 23-76.
De Muizon, P. 2005. Meaningfully distinct waters, the unitary waters theory, and the Clean Water Act: Miccosukee V. South Florida Water Management District. Ecology Law Quarterly. 32: 417-451.
DNRC. 2003. Montana’s basin closures and controlled groundwater areas. Water Resources Division: Water Rights Bureau, pp. 48-49.
Elimelech, M., W.A. Phillip. 2011. The future of seawater desalination: Energy, technology, and the environment. Science. 333: 712-718.
Environment Agency. 2013. What is Groundwater? Accessed 13 October 2013. http://www.environmentagency.gov.uk/business/topics/water.
EPA. Basic Information about Nitrate in Drinking Water. Accessed 12 November 2013. http://water.epa.gov/drink/contaminants/basicinformation/nitrate.cfm.
Evans, R., R. E. Sneed, C. K. Cassel. 1996. Irrigation scheduling to improve water- and energy-use efficiencies. Department of Agriculture, North Carolina Cooperative Extension Services. AG 452-4. Accessed October 2013. http://www.bae.ncsu.edu/programs/extension/evans/ag452-4.html.
FitzHugh, T. W., and R. M. Vogel. 2010. The impact of dams on flood flows in the United States. River Research and Applications 27:1192-1215.
Friedler, E., R. Kovalio and N.I. Galil. 2005. On-site greywater treatment and reuse in multi-storey buildings. Water Science and Technology. Accessed 16 October 2013. http://gwriic.technion.ac.il/pdf/Professors/Noah_Galil/3.pdf.
Gallatin County. 2012. Groundwater contamination sites: Gallatin Local Water Quality District. Accessed 17 October 2013. www.gallatin.mt.gov.
Ghosh, S. 2013. Future options for urban wastewater reuse. Water World. Accessed 9 October 2013. http://www.waterworld.com/articles/wwi/print/volume-20/issue-6/features/shyfuture-options-forurban-wastewater-reuse.html.
Graf, W. 2006. Downstream hydrologic and geomorphic effects of large dams on American rivers. Geomorphology 79: 336-360.
Gude, V.G., N. Nirmalakhandan, S. Deng. 2010. Renewable and sustainable approaches for desalination. Renewable and Sustainable Energy Reviews 14: 2641-2654.
Harding, R., M. Best, E. Blyth, S. Hagemann, P. Kabat, L. M. Tallaksen, T. Warnaars, D. Wiberg, G. P. Weedon, H. Van Lanen, F. Ludwig and I. Haddeland. 2011. WATCH: Current knowledge of the terrestrial global water cycle. Journal of Hydrometeorology 12.6:1149 -1156.
Hook, E. 2013a. Personal Communications, October 4, 2013.
Hook, E. 2013b. Personal Communications, October 21, 2013.
Höpner, T., and Windelberg. 1996. Elements of environmental impact studies on the coastal desalination plants. Desalination 108: 11-18.
Höpner, T., and S. Lattemann. 2008. Environmental impact and impact assessment. Science Direct 220: 1-15.
HRC. 2009. Hydropower reform commission. 12 November 2013. http://www.dameffects.org/index.html
Indah Water, I. Tank. Konsortium Sdn Bhd, 2013. Accessed 6 October 2013. http://www.iwk.com.my/#prettyPhoto/0/
International Labour Organization. 2011. Safety and health in agriculture. Accessed 15 October 2013. http://www.ilo.org/global/publications/books/WCMS_159457/lang--en/index.html
International Rivers Corp. 2002. Environmental impacts of dams. Creative Commons. Accessed 12 November 2013. http://www.internationalrivers.org/environmental-impacts-of-dams
International Water Management Institute. 2007. A comprehensive assessment of water management in agriculture. Accessed 13 October 2013. http://www.iwmi.cgiar.org/assessment/files_new/synthesis/Summary_SynthesisBook.pdf
Jones, H. G. 2004. Irrigation scheduling: advantages and pitfalls of plant-based methods. Journal of Experimental Botany. 55:407.
Kalavrouziotis, I, P. Koukoulakis, A. Papadopoulos, and A. Mehra. 2009. Heavy metal accumulation in Brussels sprouts after irrigation with treated municipal wastewater. Journal of Plant Interactions 4: 41-48.
Kang, D. and K. Lansey. 2012. Dual water distribution network design under triple-bottom-line objectives. Journal of Water Resources Planning and Management 138: 162-175.
Khawaji, A., I. Kutubkhanah, J.M. Wie. 2008. Advances in seawater desalination technologies. Desalination. 221: 47-69.
Laitos, J. G., and H. Ruckriegle. 2013. The Clean Water Act and the challenge of agricultural pollution. Vermont Law Review 37: 1033-1070.
Larsen, M. C. 2012. Global change and water resources: Where are we headed? Water Resources Impact. 14: 3-7.
Li, F., K. Wichmann, and R. Otterpohl. 2009. Evaluation of appropriate technologies for grey water treatments and reuses. Water Science and Technology. 59: 249-260.
Lindemann, J. H. 2004. Wind and solar powered seawater desalination applied solutions for the Mediterranean, the Middle East and the Gulf countries. Desalination. 168: 73-80.
Margot, J. C. Kienle, A. Magnet, M.Weil, L.Rossi, L. F. de Alencastro, C. Abegglen, D. Thonney, N. Chèvre, M. Schärer, D.A. Barry. 2013. Treatment of micropollutants in municipal wastewater: Ozone or powdered activated carbon? Science of the Total Environment, 461-462: 480-498.
McKenzie, C. 2004. Wastewater reuse conserves water and protects waterways. Small Flows Quarterly. National Environmental Services Center. Accessed 16 October 2013. http://www.worldwewant2015.org/node/303911.
McMullen, M. 2003. Water use of wheat. Prairie Grains. Issue 54. Accessed October 2013. http://www.smallgrains.org/springwh/June03/water/water.html.
Mehrizi, E.A. 2013. Kinetic analysis of organic matter removal in stabilization pond in the wastewater treatment plant of Birjand. Advances in Environmental Biology 7: 1182-1187.
Mekonnen, M. M., and A.Y. Hoekstra. 2010. The green, blue and grey water footprint of crops and derived crop products. Value of Water Research Report Series No. 47, UNESCOIHE, Delft, the Netherlands.
Montana Bureau of Mines and Technology. 2013. Overview of Gallatin County. GroundwaterInformation Center. Accessed 19 October 2013. www.mbmggwic.mtech.edu.
Montana State University. Facilities Services. 2013. Accessed October 2013. http://www.montana.edu/us/fs/FAQ/files/FacilitiesServices.pdf.
Moore, J. N., and A.S. Arrigoni. 2012. Impacts of dams on flow regimes in three headwater sub-basins of the Columbia River Basin, United States. Journal of the American Water Resources Association. 48: 925-938.
Muir, P. 2012. Eutrophication. Oregon State University. Accessed October 2013. http://people.oregonstate.edu/~muirp/eutrophi.htm.
Nachmani, A. 1997. Water jitters in the Middle East. Studies in Conflict & Terrorism 20: 67-93.
National Geographic. Water pollution. 2013. National Geographic. Accessed 15 October 2013. http://environment.nationalgeographic.com/environment/freshwater/pollution.
Northeast Georgia Regional Development Center. DATE. Watershed Protection Plan Development Guidebook: Description of Commonly Considered Water Quality Constituents. Accessed 16 October 2013. http://www.negrc.org/.
Norton-Brandão, D., S.M. Scherrenberg, and J. B. van Lier. 2013. Reclamation of used urban waters for irrigation purposes – A review of treatment technologies. Journal of Environmental Management 122: 85-98.
O’Gara, F. 2010. Striking the balance conservation farming – conservation farming and grazing systems for the semi-arid tropics of the Northern Territory. Australia Department of Primary Industry and Fisheries. Northern Territory Agricultural Association Incorporated. Katherine, Northern Territory, Australia.
Ouyang, W., A. K. Skidmore, F. Hao, A.G. Toxopeus, and A. Abkar. 2009. Accumulated effects on landscape pattern by hydroelectric cascade exploitation in the Yellow River Basin from 1977 to 2006. Landscape and Urban Planning. 93: 163-171.
Pappas, M. 2011. Unnatural resource law: Situating desalination in coastal resource and water law doctrines. Tulane Law Review. 86: 81-134.
Penate, B., L. Garcia-Rodriguez. 2012. Current trends and future prospects in the design of seawater reverse osmosis desalination and technology. Desalination. 284: 1-8.
Perrone, S. P. 2013. Louisiana Environmental Action Network v. City of Baton Rouge: The Fifth Circuit follows the trend and finds the Clean Water Act's diligent prosecution bar is a nonjurisdictional rule, to the benefit of citizen suit plaintiffs. Tulane Law Review. 87: 1375-1386.
Pimentel, D., C. Harvey, P. Resosudarmo, K. Sinclair, D. Kurz, M. McNair, S. Crist, L. Shpritz, L. Fitton, R. Saffouri, R. Blair. 1995. Environmental and economic costs of soil erosion and conservation benefits. Science. 267:1117-123.
Ram, H., Y.K.S. Singh, Saini, D.S. Kler, and J. Timsina. 2013. Tillage and planting methods effects on yield, water use efficiency and profitability of soybean–wheat system on a loamy sand soil. Experimental Agriculture. 49: 524-542.
Raschid-Sally, L.and P. Jayakody. 2008. Drivers and characteristics of wastewater agriculture in developing countries: Results from a global assessment. comprehensive assessment of water management in agriculture. International Water Management Institute. Accessed 9 October 2013. http://www.unwater.org/downloads/RR127.pdf
Reverse Osmosis (RO) Membranes, Water Desalination - NanoH2O. 2013. Nano H2O, Inc. Accessed 12 October 2013. http://www.nanoH2O.com/.
Rojas-Valencia, M.N., M.T. Orta de Velasquez, and V. Franco. 2011. Urban agriculture, using sustainable practices that involve the reuse of wastewater and solid waste. Agricultural Water Management 98: 1388-1394.
Sacks, M., and N. Bernstein. 2011. Utilization of reclaimed wastewater for irrigation of field-grown melons by surface and subsurface drip irrigation. Israel Journal of Plant Sciences 59:159-169.
Salgot, M., E. Huertas, S. Weber, W. Dott, and J. Hollender. 2006. Wastewater reuse and risk: Definition of key objectives. Desalination 187: 29-40.
Scanlon B. R., C.C. Faunt, L. Longuevergne, R.C. Reedy, W.M. Ally, V.L. McGuire, and P. B. McMahon. 2012. Groundwater depletion and sustainability of irrigation in the US High Plains and Central Valley. Proceedings Of The National Academy Of Sciences Of The United States Of America, 109: 9320-9325.
Scott, C. A., J. A. Zarazúa and G. Levine. 2000. Urban-wastewater reuse for crop production in the watershort Guanajuato river basin, Mexico. IWMI Research Report 41. International Water Management Institute. Accessed 16 October, 2013. http://www.ais.unwater.org/ais/pluginfile.php/225/mod_label/intro/Research%20 Report%20- %2041.pdf.
Seager, R., A. Tzanova, and J. Nakamura. 2009. Drought in the southeastern United States: Causes, variability over the last millennium and the potential for future hydroclimatic change. Journal of Climate 22: 5021-5045.
Shiklomanov, I. 1993. World fresh water resources. In: Water in Crisis: A Guide to the World's Fresh Water Resources. Peter H. Gleick, ed. Oxford University Press, New York.
Shilton, A. N. 2008. Solar-powered aeration and disinfection, anaerobic co-digestion, biological CO2 Scrubbing and Biofuel Production: The Energy and Carbon Management opportunities of waste stabilization ponds. Water Science & Technology 58: 253-8.
Sousa, G., D. Fangueiro, E. Duarte, and E. Vasconcelos. 2011. Reuse of treated wastewater and sewage sludge for fertilization and irrigation. Water Science and Technology. 64: 871-879.
Spirax Sarco. 2013. Introduction to condensate recovery. Accessed 6 October 2013. http://www.spiraxsarco.com/resources/steam-engineering-tutorials/condensaterecovery/ introduction-to-condensate-recovery.asp.
Stanley, E.H., and M.W. Doyle. 2003. Trading off: The ecological effects of dam removal. Frontiers in Ecology and the Environment 1: 15-22.
Steward, D. R., Bruss, P. J., Xiaoying , Y., S.A. Staggenborg, S.M. Welch, and M.D. Apley. 2013. Tapping unsustainable groundwater stores for agricultural production in the high plains aquifer of Kansas, projections to 2110. United Nations water statistics. 110, United Nations. Accessed 15 October 2013. http://www.unwater.org/statistics.htm
Subramani, A., M. Badruzzaman, J. Oppenheimer, J.G. Jacangelo. 2011. Energy minimization strategies and renewable energy utilization for desalination: A review. Water Research. 45: 1907-1920.
Suero, F. J., P. W. Mayer, and D.E. Rosenberg. 2012. Estimating and verifying United States households’ potential to conserve water. Journal of Water Resources Planning and Management 138: 299–306.
Swearingen, M. 2012. Perspective: Bozeman's long-term planning for our most valuable resource. The Bozeman Magpie 4. Accessed 13 November 2013. http://www.bozeman-magpie.com/.
Tal, A. 2011. The desalination debate—Lessons learned thus far. Environment 53: 34-48. Tampa Bay. 2010. http://www.tampabaywater.org/tampa-bay-seawater-desalinationplant/index.aspx. Accessed 9 November 2013.
Tarlock, A. D., J. N. Corbridge Jr., D. H. Getches. 2002. Water Resource Management: A Casebook in Law and Public Policy. Foundation Press, New York, New York.
Thibodeau, C., F. Monette, M. Glaus, and C.B. Laflamme. 2011. Economic viability and critical influencing factors assessment of black water and grey water source-separation sanitation system. Water Science and Technology. 64: 2417-2424.
Tomer, M. D. and K. E. Schilling. 2009. A simple approach to distinguish land-use and climatechange effects on watershed hydrology. Journal of Hydrology 376: 24-33.
Trimble, T. M. 2013. Environmental Law. Mercer Law Review. 64: 909-927.
Trinh, L., C. Duong, P. Van Der Steen, and P. Lens. 2013. Exploring the potential for wastewater reuse in agriculture as a climate change adaptation measure for Can Tho City, Vietnam. Agricultural Water Management.128: 43-54.
Ubomba-Jaswa, E. 2010. Investigating the microbial inactivation efficiency of a 25 L batch solar disinfection (SODIS) reactor enhanced with a compound parabolic collector (CPC) for household use. Journal of Chemical Technology and Biotechnology 85: 1028-1037.
UNEP and Global Environment Centre Foundation. 2004. Water and wastewater reuse: An environmentally sound approach for sustainable urban water management. United Nations Environment Programme. Accessed 9 October 2013. http://www.unep.or.jp/ietc/Publications/Water_Sanitation/wastewater_reuse/Book let- Wastewater_Reuse.pdf.
UNICEF and World Health Organization, 2012. Progress on drinking water and sanitation (978-924-1503297).WHO Press. Accessed 15 October 2013. http://www.wssinfo.org/fileadmin/user_upload/resources/JMP-report-2012-en.pdf
United Nations. 2013. United nations water statistics. Accessed 15 October 2013. http://www.unwater.org/statistics.htm.
United Nations. 2013. Food and agricultural commodities production. Accessed 14 October 2013. http://faostat.fao.org/site/339/default.aspx.
U.S. Army Corps of Engineers. 2012. Post 2011 flood event analysis of Missouri River mainstem flood control storage. U.S. Army Corps of Engineers Northwestern Division, Missouri River Basin Water Management Division, Omaha, Nebraska.
U.S. Census Bureau. 2008. Current Housing Reports, Series H150/07, American Housing Survey for the United States: 2007, U.S. Government Printing Office, Washington, D.C. 20401.
U.S. Census Data. 2010. http://www1.eere.energy.gov/vehiclesandfuels/facts/2011_fotw661.html. Accessed 10 October 2013.
U.S. Department of Agriculture. 2006. ARS, Companies Team Up To Boost Rural Economies. Accessed 10 October 2013. http://www.ars.usda.gov/is/ar/archive/may96/rural0596.htm?pf=1
U.S. Department of Agriculture-Natural Resources Conservation Service (USDA-NRCS). 2012. USDA Natural Resources Conservation Service responds to 2011 Montana floods. Montana NRCS, Bozeman, Montana. http://www.nrcs.usda.gov/wps/portal/nrcs/detail/mt/programs/financial/ewp/?cid=nrcs144p2_056229.
U.S. Department of the Interior - U.S. Geological Survey. 2013. USGS Water Science School. Where is Earth’s water? Accessed 11 September 2013. http://ga.water.usgs.gov/edu/earthwherewater.html.
U.S. EPA. 2012. Agriculture 101: Irrigation. Accessed 10 October 2013. http://www.epa.gov/agriculture/ag101/cropirrigation.html.
U.S. EPA. 2013. National Summary of Impaired Waters and TMDL Information. Accessed 16 October 2013. http://iaspub.epa.gov/waters10/attains_nation_cy.control?p_report_type=T#APRTMDL.
U.S. EPA. 2004. The National Water Quality Inventory: Report to Congress for the 2004 Reporting Cycle. Accessed October 2013. http://water.epa.gov/lawsregs/guidance/cwa/305b/upload/2009_01_22_305b_2004report_
U.S. EPA. 1992. Guidelines for Water Reuse Manual. United States Environmental Protection Agency. water.epa.gov/aboutow/owm/.../Water-Reuse-Guidelines-625r04108.pdf.
U.S. EPA. 2013. US indoor water use. WaterSense September 19. Accessed 2 October 2013. http://www.epa.gov/WaterSense/pubs/indoor.html.
U.S. EPA. 2013. Water polluted runoff: What is nonpoint source pollution? Accessed 14 October 2013. http://water.epa.gov/polwaste/nps/whatis.cfm.
U.S. Geological Service. 2013. Groundwater depletion in the United States (1900- 2008). Scientific Investigations Report 2013-5079.
van der Hoek, W., M. Ul Hassan, J.H.J. Ensink, S. Feenstra, L. Raschid-Sally, S. Munir, R. Aslam, N. Ali, R. Hussain, and Y. Matsuno. 2002. Urban wastewater: A valuable resource for agriculture. A case study from Haroonabad, Pakistan. Research Report 63. International Water Management Institute. Accessed 16 October 2013. http://www.ais.unwater.org/ais/pluginfile.php/225/mod_label/intro/Research%20 Report%20- %2063.pdf.
van Oort, F., A. Jongmans, I. Lamy, D. Baize, and P. Chevallier. 2008. Impacts of long-term waste-water irrigation on the development of sandy Luvisols: Consequences for metal pollutant distributions. European Journal Of Soil Science 59: 925-938.
von Gunten, U. 2007. The basics of oxidants in water treatment. Part B: ozone reactions. Water Science and Technology 55: 25-29.
Wagner, C. S. 2009. The untold history of the Jefferson County waste water treatment system: 1972 - Present. Cumberland Law Review. 40: 797-814.
Wason, M, S. Purhoit, D. Dehon, M. Magee. 2007. The Wastewater Treatment Process. Louisiana State University. Accessed 15 October 2013. dcomm.cxc.lsu.edu/portfolios/08spr/spuroh1/.../processfinal.pdf
Wastewater Treatment Methods and Disposal. 2009. Water/Wastewater Distance Learning. Website. Accessed 4 October 2013. http://water.me.vccs.edu/courses/ENV149/methods.htm.
Water Rights Bureau. 2012. Water rights in Montana. Montana State Government. Accessed 10 October 2013. http://www.dnrc.mt.gov/wrd/water_rts/.
Watkins, K. 2006. Human development report 2006: beyond scarcity: power, poverty and the global water crisis. Pages 33-35 in New York: United Nations Development Programme (UNDP). Palgrave Macmillan, New York, New York, USA.
World Health Organization. 2006. Guidelines for the safe use of wastewater, excreta and greywater, vol 1-4. World Health Organization. Accessed 9 October 2013. http://whqlibdoc.who.int/publications/2006/9241546824_eng.pdf.
Ying Yang, H., Z. Jun Han, S. Fung Yu, K. Leong Pey, K. Ostrikov, and R. Karnik. 2013. Carbon nanotube membranes with ultrahigh specific absorption capacity for water desalination and purification. Nature Communications. 4:2220: 1-8.