
Effect of Nitrogen Rate and Crop Rotation on Apparent Nitrogen Fertilizer Recovery in Long-term Cropping Systems

by Terry Rick, Clain Jones, Perry Miller, and Jeff Holmes
Land Resources and Environmental Sciences, MSU-Bozeman
INTRODUCTION
Crop diversification within traditional wheat-based no-till (NT) cropping systems may improve the efficiency of applied nitrogen (N) fertilizer. Pulse crops can increase N availability because of their low carbon to nitrogen ratio, while oilseeds can enhance nitrogen use efficiency (NUE) by scavenging deep N (Kirkegaard et al. 2008). Nitrogen is the leading on-farm energy input. As rotations become increasingly complex it is important to understand the relationship between N fertilization and crop N use to maximize economic return and maintain environmental quality. The goal of this study was to estimate the effect of crop rotation diversification and N rate on N fertilizer recovery (NFR) in the 10th to 13th year of a long-term diversified cropping systems study.
METHODS
A multi-year field study was initiated in 2000 at the Arthur H. Post farm in Bozeman, MT, on a well-drained Amsterdam silt loam. Five cropping systems were established; a NT continuous wheat system (CW, 2-year rotation), three NT-diverse systems (4-year rotations) and one tilled organic system (ORG, 4-year rotation) as described in Fertilizer Fact 36 (http://landresources.montana.edu/fertilizerfacts) and Miller et al. (2008). In 2004, half of the ORG plots were converted to a fully fertilized NT pesticide free production (PFP) rotation.
The three NT-diverse rotations were each divided into a high (H) and low (L) input treatment based largely on fertilizer N rate where H treatments received the recommended N fertilizer rate and L treatments received ½ the recommended rate. Nitrogen fertilizer application rates were based on residual soil N, target yield, and legume N credit (18 lb N/acre [pea & lentil] and 54 lb N/acre [sweet clover in PFP]). In 2008, the three NT-diverse rotations were changed to NT-oilseed (NTO), NT-pulse (NTP), and NT-diverse (NTD; Table 1). All rotations received ~25 lb P2O5/acre at seeding and N fertilizer application rates ranged from an average of 37 lb N/acre/year for NTP-L to 194 lb N/acre/year for CW.
Nitrogen fertilizer recovery estimates were calculated as the ratio of in-crop grain N harvested to N fertilizer applied from 2009 to 2012. Grain N removed by pulse crops was not included in the calculation as these crops were not fertilized and the ORG system was not calculated due to zero N input.
|
Cropping System
|
Phase 1
|
Phase 2
|
Phase 3
|
Phase 4
|
|---|---|---|---|---|
|
1. CW
|
S wheat
|
W wheat
|
-
|
-
|
|
2. NTO-L, -H
|
Flax
|
S wheat
|
S canola
|
W wheat
|
|
3. NTP-L, -H
|
W pea
|
W wheat
|
S lentil
|
S wheat |
|
4. NTD-L
|
S pea
|
W wheat
|
Safflower
|
OP corn |
|
NTD-H
|
S pea
|
W wheat
|
Safflower
|
Hybrid corn |
|
5. PFP
|
Sweet clover manure
|
W wheat
|
S lentil
|
Safflower |
|
ORG
|
Sweet clover manure
|
W wheat
|
S lentil
|
Safflower |
RESULTS
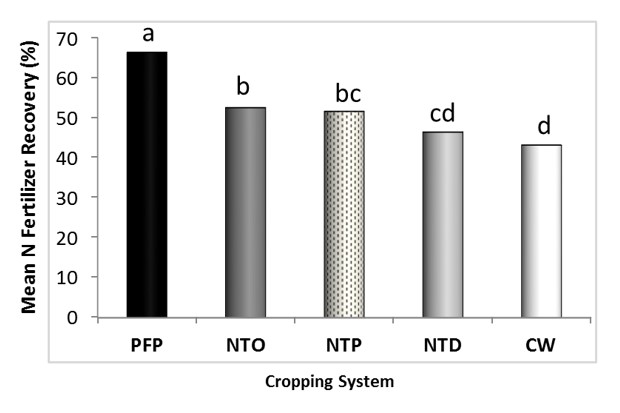
Figure 1. Nitrogen fertilizer recovery for high N input cropping systems. Bars with the same letters are the same with 95% confidence. See Table 1 for cropping system abbreviations.
In the five NT systems with high N input, NFR estimates ranged from 43% in CW to 66% in PFP (Fig. 1). CW had the lowest NFR of all treatments and it received the highest N fertilizer application rate with 779 lb N/acre applied over the 4-year period. By contrast, an average of 185 lb N/acre was applied to PFP, nearly 76% less than the amount applied to CW. For PFP, two of four rotations were cropped in legumes, spring lentil and sweet clover green manure, suggesting unfertilized legumes used in rotation increased NFR when compared to CW.
NFR in the NTO-H systems were significantly higher than CW. NTO-H systems received the second highest N fertilizer application rate, an average of 548 lb N/acre, while grain N removal by NTO was only 15% less than that of CW. In the 2009 NTO-H systems, grain N removal by flax and canola was 120% and 275% of the fertilizer N rate, respectively. In three of the four diversified systems containing legumes and/or oilseed crops, NFR was significantly higher than CW indicating crop diversification has the potential to improve NUE.
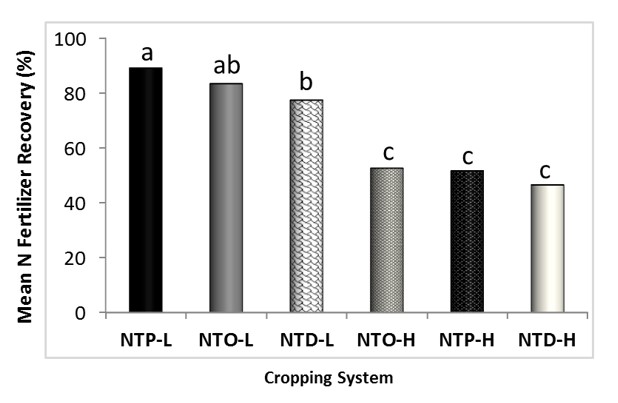
Figure 2. Nitrogen fertilizer recovery for paired high and low N input systems. Bars with the same letters are the same with 95% confidence. See Table 1 for cropping system abbreviations.
Nitrogen application rate had a positive effect on NFR in the paired H/L systems, with L systems averaging 84% NFR, nearly twice as high as the H input counterpart (Fig. 2). In general, NFR will increase as N fertilizer application rates decrease (Raun et al., 1999); however, there is a risk if insufficient N is applied that the crop may deplete soil N reserves and suffer potential yield loss.
NFR for cereal production systems worldwide are highly variable and can range anywhere from 18-50% (Cassman et al. 2002; Ladha et al. 2005). In our study, the NFR averaged over all systems was 64%, higher than global averages, likely in part due to low precipitation, resulting in lower N losses here. For diversified cropping systems in Montana, it is important to determine optimal N fertilizer rates for alternative crop sequences in order to maintain crop yield and quality and increase NUE.
FERTILIZER FACTS
- Diversifying crop rotation using legumes and oilseed crops improved NFR.
- Lowering N rates increased NFR, but care must be exercised to not compromise yield potential.
- NFR results must be coupled with crop yield and quality data, soil N data, and net returns to fully understand the effect of crop diversification and N rate in cropping systems.
REFERENCES
Cassman, K.G., A. Dobermann, and D.T. Walters. 2002. Agroecosystems, nitrogen-use efficiency, and nitrogen management. Ambio. 31(2):132-140.
Kirkegaard, J., O. Christen, J. Krupinsky, and D. Layzell. 2008. Break crop benefits in temperate wheat production. Field Crop Res. 107:185-195.
Ladha, J.K., H. Pathak, T.J. Krupnik, J. Six, and C. van Kessel. 2005. Efficiency of fertilizer nitrogen in cereal production: retrospects and prospects. Adv. Agron. 87:85-156.
Miller, P.R., D.E. Buschena, C.A. Jones, and J.A. Holmes. 2008. Transition from intensive tillage to no-tillage and organic diversified annual cropping systems. Agron. J. 100:591–599.
Raun, W.R., G.V. Johnson, and R.L. Westerman. 1999. Fertilizer nitrogen recovery in long-term continuous winter wheat. Soil Sci. Soc. Am. J. 63:645-650
ACKNOWLEDGMENTS
This study was funded by the Montana Fertilizer Advisory Committee, the Montana Wheat and Barley Committee and the Montana Agricultural Experiment Station.
Edited by Clain Jones, MSU Extension Soil Fertility Specialist, and Kathrin Olson-Rutz, Research Associate
Posted May 2021