
Mixed Cover Crop and Nitrogen Rate Effects on Wheat Yield and Protein after 6 Years

by Perry Miller, Clain Jones, Cathy Zabinski, and Jeff Holmes
Land Resources and Environmental Sciences, MSU-Bozeman, MT
INTRODUCTION
The inclusion of cover crops in U.S. cropping systems is being promoted broadly by the USDA-NRCS as a way of enhancing resilience in agriculture through more productive and weather-stable soils. Our interest is in using cover crops to ‘green up’ the summerfallow period in an economically reasonable manner (i.e., build soil without using too much water). One long-term study from Bozeman, MT, showed that pea cover cropping can be economical in the long-run (Miller et al. 2015) under a high precipitation regime by greatly increasing nitrogen (N) released from organic matter (O’Dea et al. 2015). Short-term on-farm studies have concluded economically negative effects of pea and lentil cover crops in conventional agriculture in Montana (O’Dea et al. 2013; Miller et al. 2016), but one plot-scale study near Havre, MT, in 1999-2000, showed positive economic effects (Miller et al. 2006).
Little is known in this region how plant species other than legumes may affect soil and profitability. We compared different cover crop species managed for multiple cycles with three N fertilizer rates, to understand long-term effects on soil and wheat. Here, we report the effects of different cover crops on wheat yield and protein after three cover crop cycles. Soil properties will be measured after the fourth cover crop cycle and reported in fall 2019.
METHODS
Eleven cover crop treatments (Table 1) were compared in a four-replicate plot-scale design at Amsterdam and Conrad, MT, from 2012 to 2017 (three 2-yr cycles), with cover crops grown in even years and wheat in odd years. Both sites have 2.3% organic matter content, which is typical for Montana. The Amsterdam site is silt loam with average annual precipitation near 14 inches. The Conrad site is clay loam and has a longterm average annual precipitation of 11-12 inches. Average growing season precipitation is similar between these sites but the Amsterdam site receives greater fall, winter, and early spring precipitation, enabling potentially greater overwinter soil water recharge.
All systems were managed as no-till and with short wheat stubble (<1/4 of mature plant height). Cover crops were planted in early April in 2012, and the first week of May in 2014 and 2016, reflecting more typical producer practice whereby spring cash crop sowing has higher priority. Cover crops were terminated with glyphosate in late June in 2012, and first week of July in 2014 and 2016. Wheat was grown in 2013, 2015, and 2017. The N-fixers group consistently had some tolerance to glyphosate, with lingering plant growth compared to non-legume species, and likely more soil water use. Biomass differences among cover crop treatments were uncommon and small when they occurred (data not shown) so differences in wheat responses were ascribed more to the type, than the amount, of cover crop biomass. Year-6 winter wheat was sown September 2016 at right angle to the cover crop treatments, using N fertilizer rates of 0, 117, and 234 lb urea/ac (0, 54, and 108 lb N/ac). Wheat was harvested for yield and grain subsamples analyzed for moisture, test weight, and protein content via NIR spectroscopy.
|
Cover Crop Treatments
|
||||
|---|---|---|---|---|
|
1) Fallow
|
Plant-free control, weeds managed with glyphosate as needed
|
|||
|
2) Pea
|
Arvika spring forage pea; legume ‘control’ providing linkage to previous studies
|
|||
|
3) Full mix
|
Brassica + Fibrous + N Fixer + Tap Root functional groups
|
|||
|
4) Brassica
|
Winter canola (Dwarf Essex) and Tillage Radish (vns)
|
|||
|
5) M Brassica
|
Full Mix minus Brassica group and minus Turnip (vns)
|
|||
|
6) Fibrous*
|
Oat (Oatana) and Canaryseed (CDC Maria)
|
|||
|
7) M Fibrous
|
Full Mix minus Fibrous group
|
|||
|
8) N Fixers**
|
Lentil (Indianhead) and Pea (Arvika)
|
|||
|
9) M N Fixers
|
Full Mix minus N Fixers group
|
|||
|
10) Tap
|
Turnip (vns) and Safflower (MonDak)
|
|||
|
11) M Tap
|
Full Mix minus Tap roots group
|
|||
|
*Perennial ryegrass was used in 2012 but concerns about introducing a weedy species
caused a change to canaryseed.
** Common vetch was used in 2012 but its slow kill with glyphosate at termination caused a change to lentil. |
||||
RESULTS
The 2017 growing season was characterized by very favorable spring soil moisture,
followed by a sharp summer drought beginning mid-June at both sites. Amsterdam received
1.5 inches greater rainfall during Apr–June than Conrad. Fertilizer N rates were the
dominant factor for wheat yield and protein at both locations. Medium and high N rates
increased wheat yield by 5.9 and 7.7 bu/ac, respectively, at Amsterdam, and decreased
wheat yield by 2.8 and 7.1 bu/ac,
respectively, at Conrad, due to ‘haying off’. Overall average winter wheat yields
on the Fallow control plots were very similar between Amsterdam (33 bu/ac) and Conrad
(35 bu/ac). However, wheat yield after cover crops generally did not differ greatly
from after Fallow at Amsterdam, while yields on cover crop treatments averaged 11
bu/ac (31%) less than on Fallow at Conrad. Thus, yield results were more constrained
by N at Amsterdam, and by water at Conrad. Grain protein was enhanced by N at both
locations, increasing from 10.8% with zero fertilizer to 13.7% and 14.7% at the medium
and high N rates, respectively, at Amsterdam, and from 10.3% to 14.5% and 15.8%, respectively,
at Conrad. Given the overwhelming effect of N fertilizer, it was important to look
for finer differences among cover crops at only one N rate. The medium N rate was
used for subsequent comparisons below (Figure 1).
At Amsterdam the only yield difference of note was that wheat after the Brassica group
yielded 3.9 bu/ac greater than after the Minus Brassica group (P<0.05). This was consistent
with results from the more water-limited Conrad site where the Brassica group yielded
6.1 bu/ac greater than the Minus Brassica group. At Amsterdam, wheat yield following
the Full Mix was 3.9 bu/ac greater (P<0.10) than Fallow, suggesting a positive soil
effect due to biomass accumulation over time. However, the opposite was true at drier
Conrad where the Full Mix yielded 9.9 bu/ac less than Fallow (P<0.05). At Conrad,
wheat after the Pea control was 3.5 bu/ac greater (P<0.10) than after the Full Mix,
and with equal biomass production, it suggests that the timing of N release from Pea
proved beneficial to yield in 2017, unlike in much
drier 2015 (only 3.5 inches during growing season, with no rain from June 2 to July
5) where it exacerbated ‘haying off’ in spring wheat. Interestingly, the Fibrous group
had much reduced yield (9.1 bu/ac) compared with the Minus Fibrous treatment, suggesting
a biotic factor associated with wheat following monocot cover crops on a farm with
a predominant small grain history. This would be consistent with unusually wet soil
in fall and spring at this location.
The most notable aspect of grain protein was that the N Fixers increased protein from 13.2% to 14.0% at Amsterdam, and 14.2% to 15.8% at Conrad, compared with the Minus N Fixers treatment. This suggests that in water- or N-limited contexts, legumes play a key role in increasing wheat protein. Other protein differences at Conrad were either due to yield dilution effects on N (13.9% for Brassica vs 14.7% for Minus Brassica), or reinforced the notion of a pathogenic compromise for wheat following monocot cover crops (13.6% for Fibrous vs 14.7% for Minus Fibrous).
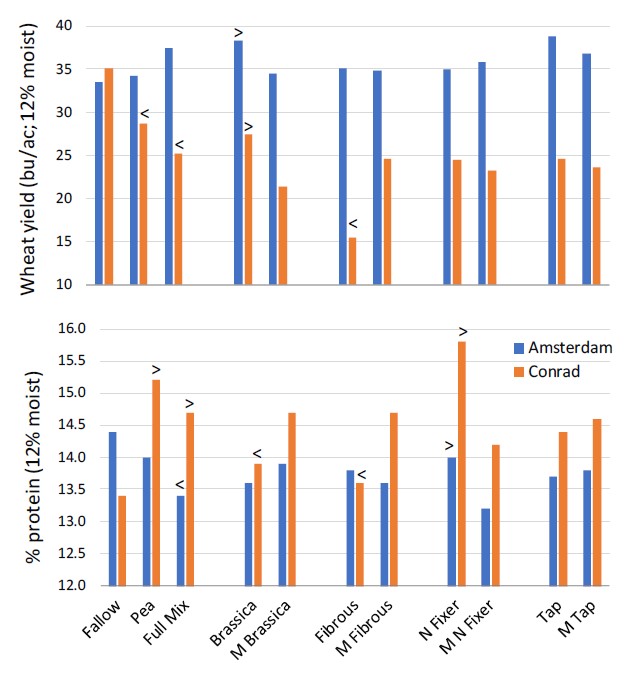
Figure 1. Winter wheat yield and protein fertilized with 54 lb N/ac following different cover crop treatments after three complete rotational cycles at Amsterdam and Conrad, MT, 2017. See Table 1 for crop treatment legend. ‘<’ and ‘>’ represent significant difference among same colored bars within a cluster (P<0.05).
FERTILIZER FACTS
- Compared with Fallow, cover crops after three cycles reduced wheat yield at a low rainfall site (Conrad = 5.0 inches Apr-July), but not at a site with greater growing season rainfall (Amsterdam = 6.5 inches Apr-July).
- Legume cover crops contributed more available N to the soil than non-legume crops, potentially increasing yield and very consistently increasing grain protein.
- Brassica cover crops increased wheat yield, compared with non-Brassica cover crops, at two contrasting locations, after three cover crop cycles. Further study is needed to understand this response.
- N fertilizer greatly increased grain protein at both sites and yield at Amsterdam after cover crops, suggesting cover crops can’t supply enough N to meet wheat needs and prevent protein discounts.
ACKNOWLEDGMENTS
This study was funded by the Montana Fertilizer Advisory Committee and the USDA-NIFA
Ag Experiment Station Project
MONB00351.
REFERENCES
Miller et al. 2016. Using cover crop mixtures to improve soil health in low rainfall
areas of the northern plains. Final
Report. April 2016. 40 pp. https://projects.sare.org/sare_project/SW11-099/
Miller et al. 2015. Pea in rotation with wheat reduced uncertainty of economic returns
in southwest Montana. Agron. J.
107:541-550. https://doi.org/10.2134/agronj14.0185
Miller et al. 2006. Cropping sequence effect of pea and pea management on spring wheat
in the northern Great Plains.
Agron. J. 98: 1610-1619. https://doi.org/10.2134/agronj2005.0302
O’Dea et al. 2015. Legume, cropping intensity, and N-fertilization effects on soil attributes and processes in soils from an eight-year-old semiarid wheat system. Nutr. Cycl. Agroecosyst.102:179-194. https://doi.org/10.1007/s10705-015-9687-4
O’Dea et al. Greening summer fallow with legume green manures: On-farm assessment in north-central Montana. J. Soil. Water. Conserv. 68:270-282. https://doi.org/10.2489/jswc.68.4.270
Edited by Clain Jones, MSU Extension Soil Fertility Specialist, and Kathrin Olson-Rutz, Research Associate
Posted May 2021