
Yield Responses of Canola, Yellow Mustard, Pea, and Wheat to Sulfur Fertilizer

A printable PDF version is available.
Clain Jones1, Perry Miller1, Pat Carr2, Simon Fordyce2, Samuel Koeshall1, Aneliya Cox1, Rosie Wallander1, Joao Souza1
1Land Resources and Environmental Sciences, Montana State University, Bozeman, MT
2Central Agricultural Research Center, Montana State University, Moccasin, MT
INTRODUCTION
Sulfur (S) deficiencies have increased in Montana in the past decade based on trends in soil test data (Agvise Laboratories, unpub data) and observations. These deficiencies are likely due to grain harvest removing more S than is often provided with S fertilizer. Yield of spring lentil – a crop with relatively low S needs - increased in four of 20 site-years with only 5 lb S/acre added in Montana and North Dakota (Baber et al. 2022; Miller et al. 2024). Expecting that crops with higher S needs could also respond to S, we 1) determined the S fertilizer needs of canola, yellow mustard, and wheat, and 2) identified S soil tests and sampling depths that best predict S availability and yield responses to S fertilizer. This fact sheet addresses goal 1, and Fertilizer eFact 88 addresses goal 2.
METHODS
Trials were conducted at the Central Agricultural Research Center (CARC) in Moccasin, the Post Farm (PF) near Bozeman, and the Western Triangle Agricultural Research Center (WTARC) near Conrad. Table 1 shows crop varieties grown in each year and location. Treatments consisted of two S sources (potassium sulfate, gypsum) applied at three rates (7.5, 15, and 30 lb S/acre in 2023; 3.75, 7.5 and 15 lb S/acre in 2024 and 2025), plus a 0S control. Potassium sulfate was used rather than ammonium sulfate (21-0-0-24) to avoid adding different levels of nitrogen (N) with the S source. They are similarly soluble. The S was mid-row banded at CARC and PF, and surface broadcast at WTARC. Given high mobility of S, we didn’t expect placement method to affect response. Granular inoculant (Exceed®) was applied in-furrow with pea seed. Urea was applied to canola, mustard, and wheat based on MSU fertilizer guidelines (Jacobsen et al. 2005) and typical yield potentials per site. Monoammonium phosphate was applied in-furrow at 23 lb P2O5/acre. All sites had potassium levels above the critical level of 250 ppm and no potash was applied.
|
Year
|
CARC
|
PF
|
WTARC
|
|---|---|---|---|
|
2023
|
Canola Winfield CP9978TF Pea AAC Profit Wheat Vida |
Pea AAC Profit Wheat Vida |
Canola Winfield CP9978TF Pea AAC Profit |
|
2024
|
Pea AAC Profit Wheat Vida |
Pea AAC Profit Wheat Vida |
none
|
|
2025
|
Canola Winfield CP9978TF Mustard Andante |
Mustard Andante
|
none
|
Soil was sampled the summer or fall before seeding to identify locations with relatively uniform and low levels of soil S and nitrate. Soil was also sampled within four weeks of seeding by block and for each crop at 0-6, 6-12, and 12-24 inch depth (or to rock at CARC). Soil was analyzed for available S by extracting with a monocalcium phosphate (Caphos) solution, which is the reference method in the western U.S. (Miller et al. 2013), and analyzed with inductively coupled plasma (ICP) which measures dissolved inorganic S (i.e., sulfate) plus organic S. Three other soil S test methods were used and detailed in Fertilizer eFact 88. Crops were combine-harvested. Soil sulfate levels were below 20 lb S/acre (top 24 in.) at CARC and PF in all years, and at WTARC in 2024, but averaged 179 lb S/acre at WTARC in 2023 (Table 2). Soils were classified as silt loam or clay loam (2024) at PF, and clay loam at CARC and WTARC.
| Parameter | CARC | PF | WTARC | |||||
|---|---|---|---|---|---|---|---|---|
| 2023 | 2024 | 2025 | 2023 | 2024 | 2025 | 2023 | 2024 | |
| pHa (1:1), 0 - 6 in. | 7.1 | 7.2 | 7.0 | 7.2 | 6.3 | 6.4 | 7.9 | 7.1 |
| SOM (LOIb), 0 - 6 in. (%) | 4.0 | 4.2 | 4.0 | 2.9 | 2.9 | 2.5 | 3.5 | 2.7 |
| Caphos ICP S, 0 - 24 in.c (lb/acre) | 8.9 | 19.3 | 5.9 | 14.6 | 11.0 | 8.9 | 179d | 17.6 |
|
a Soil pH and SOM are averages across crops (n=3 in 2023 and 2024; n=1 or 2 in 2025). Sulfur (S) levels are averages across block and crop (n=12 in 2023 and 2024; n=4 or 8 in 2025). b Loss on ignition. c At CARC, 0 to rock, meaning core rejection (typically at 12 to 20 inches). d Confirmed. |
||||||||
Growing season precipitation (May-July) varied widely among sites and years, with CARC receiving more precipitation than average each year, and PF and WTARC receiving less than average (Table 3).
|
Site
|
2023
|
2024
|
2025
|
Long-term average
|
|---|---|---|---|---|
|
CARC
|
7.4
|
6.4
|
8.3
|
5.7
|
|
PF
|
6.0
|
6.4
|
3.6
|
6.6
|
|
WTARC
|
4.7
|
3.3
|
--
|
6.4
|
RESULTS and DISCUSSION
Yield responses were not different between gypsum and potassium sulfate except in two instances, noted below.
Canola yields increased by 17 bu/acre with S fertilization at CARC in 2023 and up to 19 bu/acre in 2025 (Figure 1). Yields did not increase at S rates above 7.5 lb S/acre in either year. Gypsum resulted in lower canola yields than potassium sulfate at CARC in 2023, likely due to gypsum’s lower solubility, canola’s high early demand for S, and highly S-deficient soil. Canola grain yields did not increase significantly with S at WTARC, likely due to very high soil S levels.
Wheat yields increased 15 bu/acre at PF and 8 bu/acre at CARC in 2023 with S fertilizer; there was no S response at either site in 2024 (Figure 1). Mustard yields increased by 400 lb/acre at PF in 2025 and by approximately 150 lb/acre at CARC in 2025 with 15 lb S/acre (Figure 1). Pea yield did not increase with either S fertilizer in any of the five site years, except at CARC in 2023, when pea yield increased by 5 bu/acre with 15 lb S/acre as gypsum.
Crops grown on soils with low S levels can be highly responsive to S fertilizer, especially if the S demand is high, such as by brassicas and high yielding wheat. Given relatively low S needs and cost of S fertilizer (less than $1/lb S, when the value of N in ammonium sulfate is considered), S can result in very high returns on investment, especially on brassicas such as canola and mustard. Sulfur fertilizer is strongly recommended when S tests are less than optimum S rates based on crop and yield (Fertilizer eFact 88). Given low cost of S, S fertilizer should be considered cheap insurance even if soil S is not measured or is not very low (e.g., less than 15 lb S/acre).
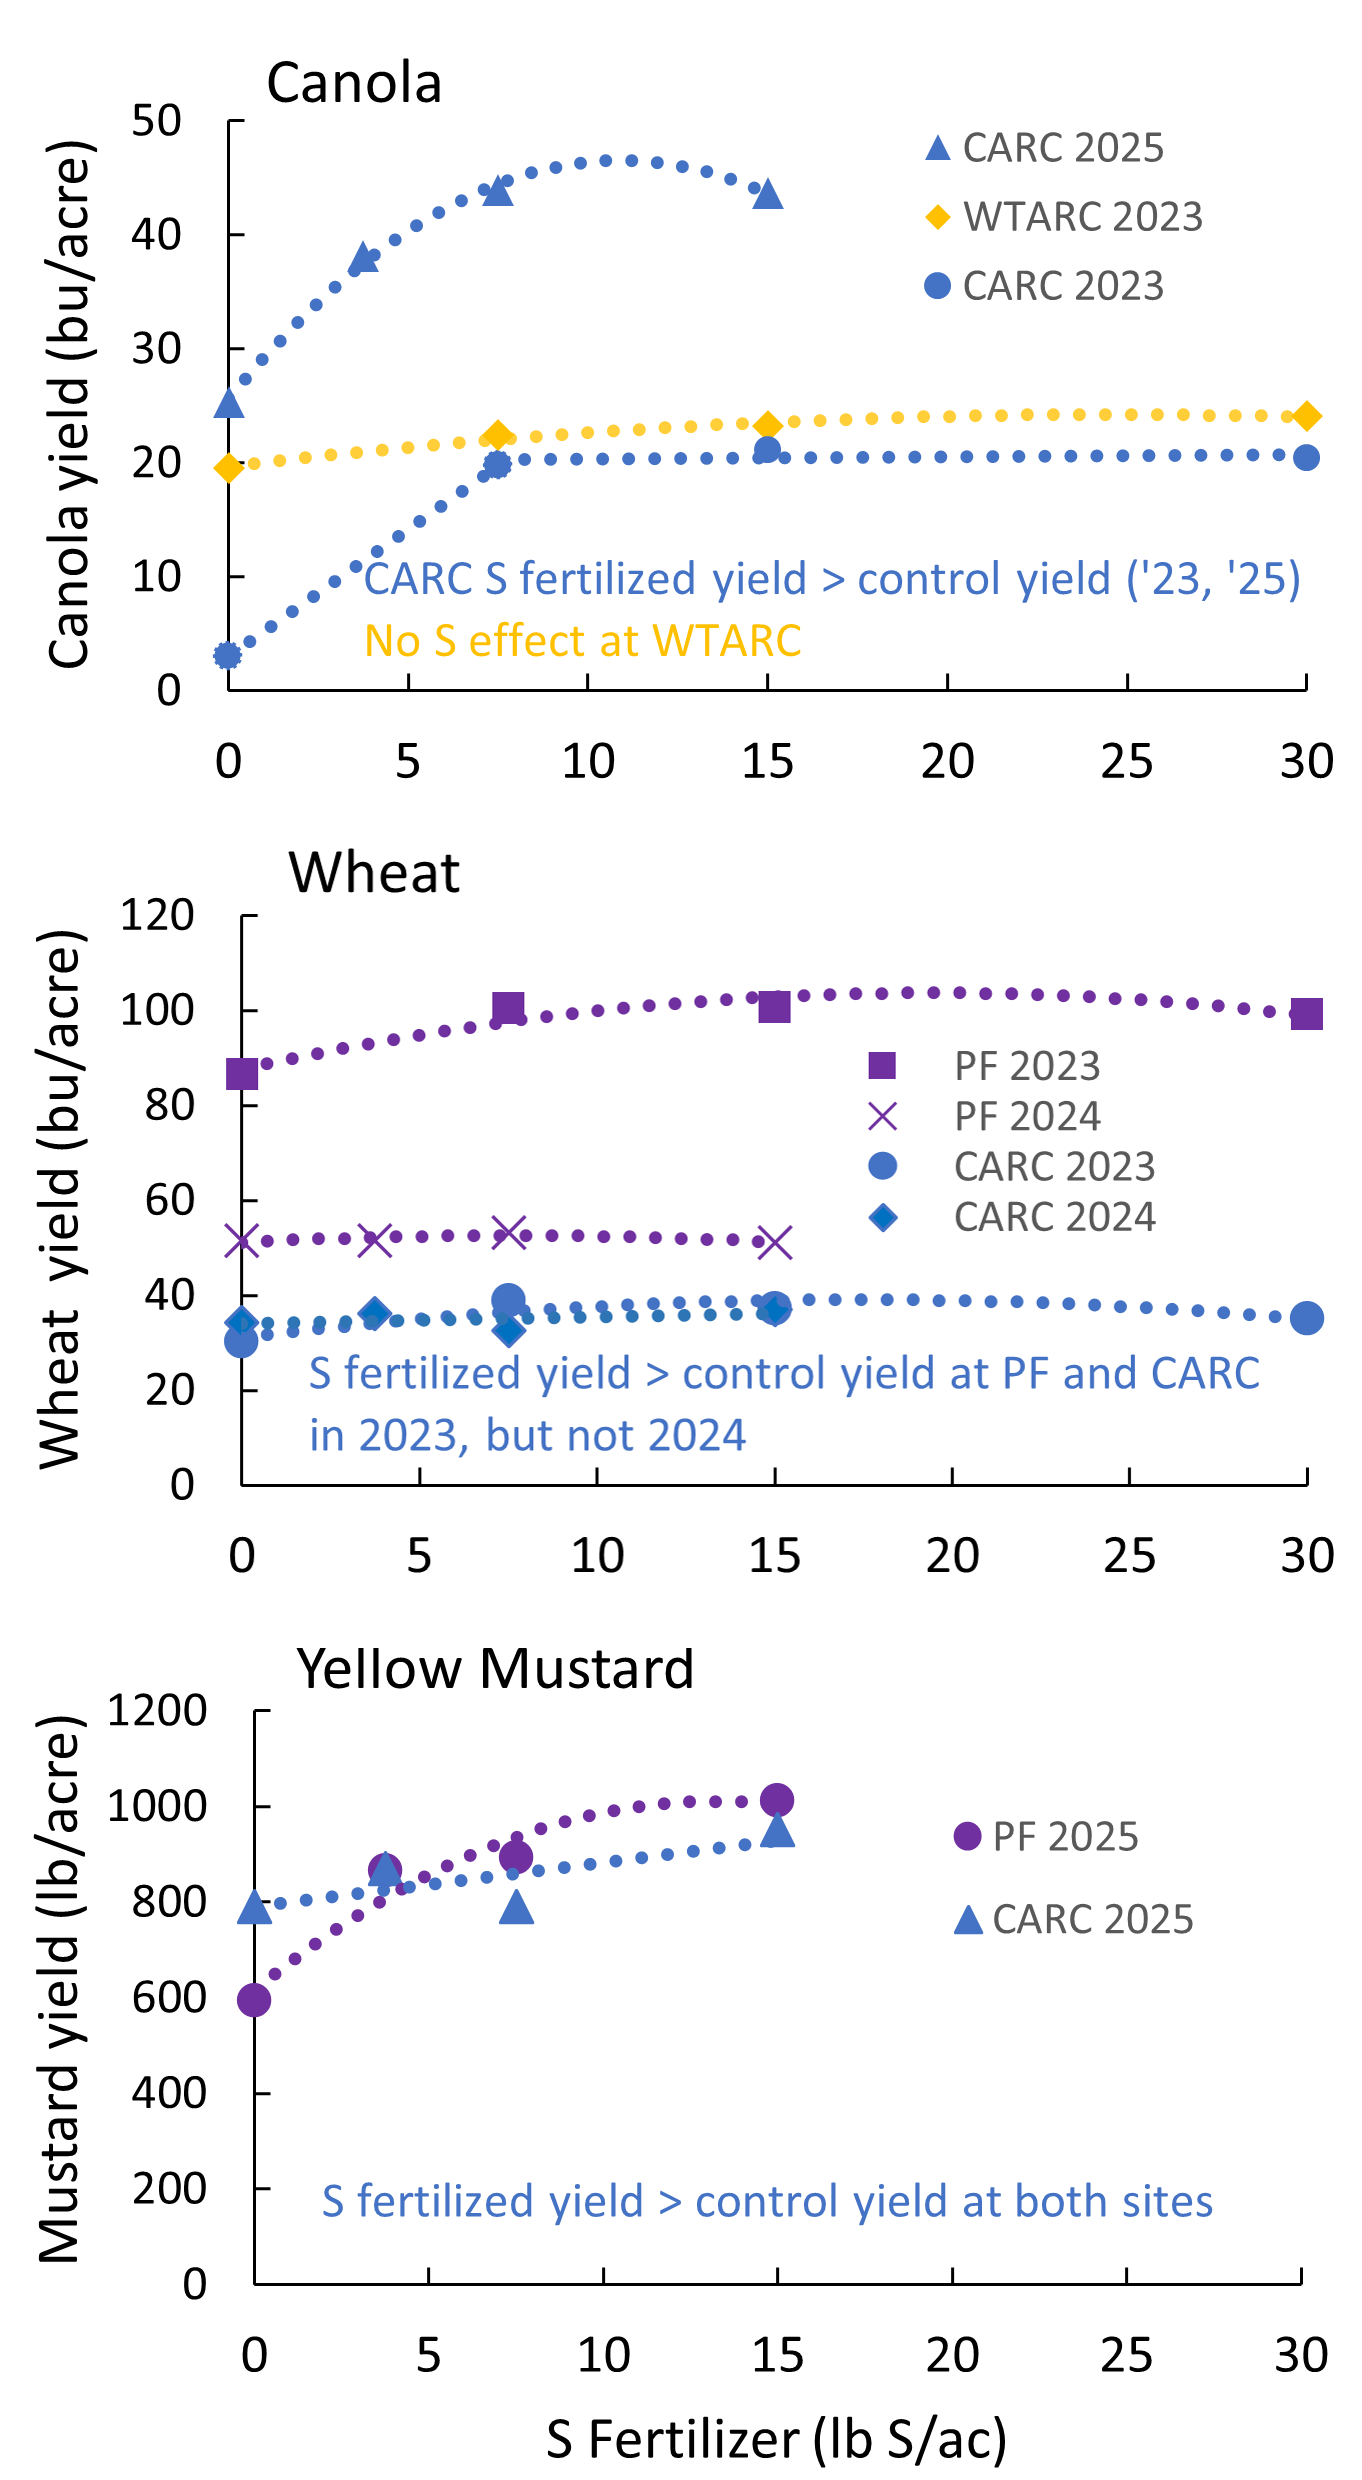
Figure 1. Canola (at 8.5% moist.), wheat (at 12% moist.), and mustard (at 8.5% moist) yield responses from S at four rates. Yields are averages for potassium sulfate and gypsum treatments except for canola at CARC in 2023, where yields are for potassium sulfate only due to consistently lower yields with gypsum.
FERTILIZER FACTS
- Yield increased with S fertilization in six of 14 trials, including four of five trials with canola and yellow mustard.
- Yield increases were often substantial, easily offsetting cost of the S fertilizer, especially for canola and yellow mustard.
- All yield responses to S fertilizer were on soils with low S (less than 15 lb S/acre in top 2 ft.)
REFERENCES
Baber, K., et al. 2022. Lentil Yield and Nitrogen Fixation Response to Inoculant and Fertilizer. Fertilizer eFact No. 81. MSU Extension.
Jacobsen, J., et al. 2005. Fertilizer Guidelines for Montana Crops. EB0161. MSU Extension.
Miller, P.R., et al. 2024. Inoculant and fertilizer effects on lentil in the northern Great Plains. Agron Jour. 116 doi 10.1002/agj2.21501
Miller, R., et al. 2013. Soil, Plant and Water Reference Methods for the Western Region. WREP-125. 4th edition. 155 pp. https://www.soils.org/files/napt/publications/method-papers/western-states-methods-manual-2013.pdf
Funded by Montana Fertilizer Check-off
Edited by Clain Jones, MSU Extension Soil Fertility Specialist, and Kathrin Olson-Rutz, Research Associate
Posted June 2026