
Evaluation of Available Soil Sulfur Test Methods and Sampling Depths

Clain Jones1, Perry Miller1, Pat Carr2, Simon Fordyce2, Samuel Koeshall1, Aneliya Cox1, Rosie Wallander1, Joao Souza1
1Land Resources and Environmental Sciences, Montana State University, Bozeman, MT
2Central Agricultural Research Center, Moccasin, MT
INTRODUCTION
Sulfur (S) deficiencies have increased in Montana in the past decade, yet MSU S fertilizer guidelines have not been established because the relationship between soil S tests and crop response is unclear (Jacobsen et al. 2005). Determining S fertilizer rates based on soil S tests has been challenging because: 1) a substantial amount of S can become available after soil sampling due to decomposition of soil organic matter and crop residue, 2) available S levels are often higher deeper in the root zone, but below typical sampling depths, 3) field variability of available S can be very high, and 4) lime (calcium carbonate) can ‘coat’ gypsum (calcium sulfate) making the S in gypsum unavailable in the field but available in a lab test where soils are ground, saturated, and shaken. Of these, 1) and 2) can result in lack of a yield response from S fertilizer even at low measured soil S levels, and 3) and 4) can result in a yield response despite high measured available soil S levels. In addition, there are numerous S soil tests, yet it is unknown which best reflects S availability and crop response in Montana. This study’s goals were to 1) identify S soil tests and sampling depths that best predict S availability and yield responses to S fertilizer (this Fertilizer eFact) and 2) determine the S fertilizer needs of canola, yellow mustard, spring pea, and wheat (Fertilizer eFact 87).
METHODS
Spring canola, yellow mustard, field pea, and wheat were grown at Post Farm (PF), Central Ag Research Center (CARC), and Western Triangle Agricultural Research Center WTARC) from 2023-2025 with four S rates and two S sources. More detail is provided in Fertilizer eFact 87. Soil was sampled within four weeks of seeding for each crop by treatment at 0 to 6, 6 to 12, and 12 to 24-inch depths (or to rock at CARC). All soil was analyzed for available S by extracting with monocalcium phosphate (Caphos) solution, which is the reference method in the western U.S. (Miller et al. 2013), ammonium acetate (NH4OAc; Joines and Hardy 2014) on S-responsive site-years, and Mehlich-3, an acidic extractant (Joines and Hardy 2014) in 2023 only. All extracts were analyzed with inductively coupled plasma (ICP), which measures the sum of dissolved inorganic and organic S. Caphos extracts were also analyzed with an ion chromatograph (IC) which measures only inorganic S (i.e., sulfate). Within ten days of combine harvest, three feet of one row from each 0 and 15 lb S/acre potassium sulfate plot was cut to the ground, dried, and hand-threshed. Grain and leaves/stems were analyzed for tissue S with combustion. Aboveground S uptake (lb S/acre) was calculated by multiplying combine-harvested grain S by the plant S/grain S ratio from the hand-threshed samples.
To determine which sampling depths and soil tests best estimated S availability, aboveground S uptake in the controls was compared with 0 to 6, 0 to 12 and 0 to 24-inch (or 0 to rock at CARC) soil S amounts (lb S/acre) for S-responsive trials across crops, sites, and years. The assumption was that on S-responsive sites, plants grown in control plots would scavenge most of the available S and thus S uptake should be positively related to available soil S at seeding. Gross revenue was calculated assuming $6/bu wheat, $8/bu pea, $10/bu canola, and $0.40/lb mustard. Cost of S for non-legumes was set at $0.50/lb S. This was based on 5-year average MT costs of ammonium sulfate and subtracting the value of the nitrogen (N as urea) in the ammonium sulfate, because less urea will need to be applied. For pea, the S cost was set at $1.10/lb S, which assumes no value of the N in ammonium sulfate because pea fixes N.
RESULTS and DISCUSSION
Soil sulfate levels (Caphos ICP) were below 20 lb S/acre (0 to 24-inch) in seven of the eight site-years (Table 1).
|
Parameter
|
CARC
|
PF
|
WTARC
|
|||||
|---|---|---|---|---|---|---|---|---|
|
2023
|
2024
|
2025
|
2023
|
2024
|
2025
|
2023
|
2024
|
|
|
pHa (1:1), 0 - 6 in.
|
7.1
|
7.2
|
7.0
|
7.2
|
6.3
|
6.4
|
7.9
|
7.1
|
|
SOM (LOIb), 0 - 6 in. (%)
|
4.0
|
4.2
|
4.0
|
2.9
|
2.9
|
2.5
|
3.5
|
2.7
|
|
Caphos IC S, 0 -24 in. (lb/ac) c
|
2.1
|
8.4
|
2.4
|
4.8
|
5.8
|
4.1
|
188
|
9.5
|
|
Caphos ICP S, 0 - 24 in. (lb/ac)
|
8.9
|
19.3
|
5.9
|
14.6
|
11.0
|
8.9
|
179
|
17.6
|
|
NH4OAc S, 0 - 24 in. (lb/ac)
|
10.1
|
-
|
6.0
|
16.0
|
-
|
10.4
|
-
|
-
|
|
Mehlich-3 S, 0 - 24 in. (lb/ac)
|
61.1
|
-
|
-
|
77.6
|
-
|
-
|
525
|
-
|
|
Soil textured
|
cl
|
cl
|
cl
|
sil
|
cl
|
sil
|
cl
|
cl
|
|
a Soil pH and SOM are averages across crops (n=3 in 2023 and 2024; n=1 or 2 in 2025). Sulfur (S) levels are averages across block and crop (n=12 in 2023 and 2024; n=4 or 8 in 2025). b Loss on ignition. c At CARC, 0 to rock meaning core rejection (typically at 12 to 20 inches). d cl – clay loam, sil – silt loam |
||||||||
Sampling depth and soil tests
There was no relationship between S uptake and the 0 to 6-inch available S for any soil test. Only the Caphos ICP S pool in the 0 to12-inch depth was correlated with S uptake, though weakly (R2=0.28; data not shown). Sulfur uptake was related to soil S amounts in the 0 to 24-inch depth for Caphos IC (R2 = 0.53), Ca phos ICP (R2=0.35), and NH4OAc (R2 = 0.25), but not Mehlich-3. Given that these S uptake vs soil S relationships come from three crops with different rooting depths and three years with likely different amounts of S released from soil during the growing season, though relatively weak, these correlations suggest that the soil tests adequately estimate relative amounts of available soil S. In other words, it’s likely better to test soil S, than not.
We know of no commercial labs that use IC for S, while the Caphos ICP method is used by several laboratories in the west. Therefore, we opted to use Caphos ICP S levels as the best estimate of available S for our economic analysis below. Since NH4OAc S levels were only slightly greater than Caphos ICP S levels, NH4OAc is likely also a suitable S test.
Economics
Net revenue from S was related to available S (Caphos ICP S in top 24 inches plus fertilizer S) for the six trials where yield was responsive to S (Fertilizer eFact 87), for pea at CARC in 2023, and weakly for wheat at PF in 2024. Economically optimum S rates (EOSR, Table 2) were strongly related to aboveground S content when S was sufficient, meaning at the S rate that was closest to the maximum yield (Figure 1, R2=0.90). This relationship is expected for a nutrient that is largely dissolved and not bound to soil – as the crop takes up more S with higher yields, the available S needs to increase proportionally with yield. This is similar to N rate guidelines, which are yield-dependent in much of the western U.S. Although this relationship was based on only eight points, the strength of the relationship gives us some confidence in recommending S rates for the four crops tested (Table 2). Farmers are encouraged to keep records and do strip trials to fine tune needed S rates for their production systems.
|
Crop
|
EOSRa
|
|
|---|---|---|
|
lb S/bu
|
lb S/cwt
|
|
|
Spring canola
|
0.64
|
1.28
|
|
Yellow mustard
|
1.30b
|
2.50
|
|
Spring pea
|
0.29
|
0.48
|
|
Spring wheat
|
0.27
|
0.45
|
|
a Fertilizer S need = EOSR x yield goal (bu or cwt) – soil S in top 24 inches. b Uses a mustard test weight of 52 lb/bu. |
||
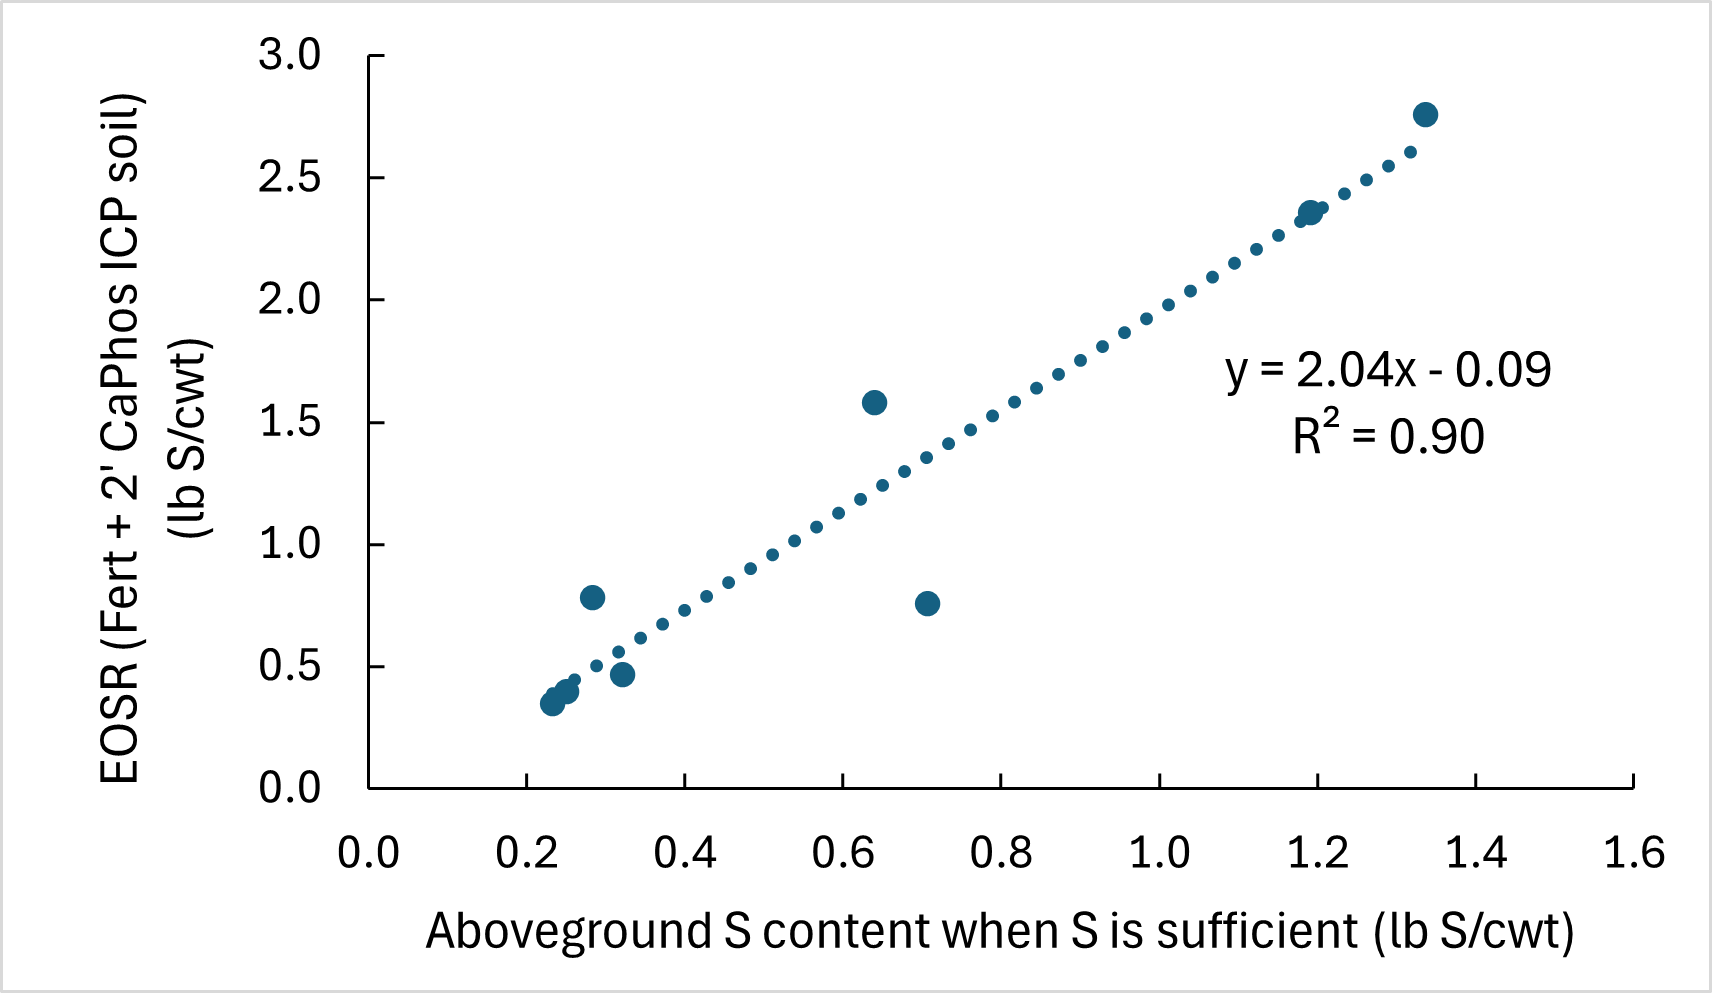
Figure 1. Economic optimum S rate vs above ground S content when soil S is sufficient across site, year and crop. Units were standardized across crops to lb S/cwt.
FERTILIZER FACTS
- Sulfur pools in the top 24 inches for three of the four soil S test methods were somewhat related to crop S uptake, suggesting they do an acceptable job of estimating available S.
- Soil S in the top 6 inches was not related to S uptake, very likely because it represents a small fraction of the root zone S.
- The recommended S soil test method in the western U.S. (calcium phosphate) analyzed by ICP was adequate at estimating soil S availability and S fertilizer rates.
- Similar to N fertilizer guidelines, S should be added based on yield goal, the EOSR for the specific crop, and adjusted using top 24-inch soil S.
REFERENCES
Jacobsen, J., G. Jackson, and C. Jones. 2005. Fertilizer Guidelines for Montana Crops. EB0161. MSU Extension, Bozeman, Montana.
Joines, D.K. and D.H. Hardy. 2014. Acetate and Mehlich-3 Extractable Sulfate-Sulfur. In Soil test methods from the southeastern United States. Eds. Sikora, F.J. and K.P. Moore. Southern Cooperative Series Bulletin No. 419. 211 p.
Miller, R., R. Gavlak, and D. Horneck. 2013. Soil, Plant and Water Reference Methods for the Western Region. WREP-125. 4th edition. 155 pp. https://www.soils.org/files/napt/publications/method-papers/western-states-methods-manual-2013.pdf
Funded by the Montana Fertilizer Check-off
Edited by Clain Jones, MSU Extension Soil Fertility Specialist, and Kathrin Olson-Rutz, Research Associate
Posted June 2025