


Cover Crops: Management for Organic Matter and Nitrogen
EB0237
New 2022
By Clain Jones, Extension Soil Fertility Specialist and Professor1; Kathrin Olson-Rutz,Research Associate1; Perry Miller, Cropping System Professor1
Cathy Zabinski, Belowground Ecology Professor1, Susan Tallman, State Agronomist and Certified Crop Advisor2
1 Department of Land Resources and Environmental Sciences, Montana State University
2 USDA-NRCS
Overview
This publication presents how cover crop species selection and management affect soil
organic matter (SOM) and nitrogen (N). Our focus is on cover crops planted as summer
fallow or partial-summer fallow replacement in dryland systems. The effect of covers
on other soil health properties is covered in Cover Crops: Soil Health. The impact of covers’ water use and soil N on the subsequent small grain cash crop
is presented in Cover Crops: Soil Water and Small Grain
Yield and Protein. The MontGuide Cover Crops as Partial Replacement of Summer Fallow presents a main summary of information from these three bulletins.
The decision to plant covers should start with defining the purpose of including a
cover in rotation. Cover management, and determining cover success, depends on the
goal(s). For example, the focus may be on the most cost-effective production of biomass
(above and below ground plant material),
or the focus could be to provide supplemental forage at a time when perennial forage
is limiting. These are likely not achieved with the same cover species or management
(1, ND).
Soil organic matter (SOM), which drives soil health, depends on residue input. If
the purpose of growing a cover is primarily to build SOM, then residue must be looked
at over the whole cropping system. Covers generally decrease the following cash crop
in semi-arid regions, which means there is less straw input from the cash crop to
build SOM. The amount of cover residue grown one year cannot be less than the loss
of cash crop residue the next year if the whole system goal is to gain plant residue
and SOM. There is tradeoff between letting covers grow longer to produce more residue,
and the need to retain soil water for the following cash crop. Termination by first
flower can provide the benefits of partial fallow replacement and preserve soil water.
If water is not the main resource limiting crop production, full-season and over-winter
covers provide more residue to build SOM than partial-fallow and spring-planted covers.
In Montana’s dryland cropping systems, pea or cover mixes with legumes generally lead
to higher overall residue production (cover plus cash crop) than covers without legumes.
Legumes are especially helpful in low N soils or systems with low N fertilization.
Legume covers are often used for the purpose of supplying soil N. Some covers are
planted to ‘catch’ residual soil N and reduce leaching losses. Plant available N (PAN,
the N that becomes available for plant uptake from residue decomposition) from covers
depends on the amount of N in the residue and the rate of residue decomposition. To
add PAN, covers must contain legumes (for example, lentil, field pea). Covers terminated
at flower bud stage are higher in N content than if let grown to maturity. Residue
decomposition is slow in cool, dry, no-till systems. However, high N residue decomposes
faster than high carbon (C) residue. Covers terminated by tillage decompose faster
to release N, than covers terminated by herbicide and left on the soil surface.
Grazed covers have different residue and N cycling, and economics, than ungrazed covers
and will be discussed in a later bulletin.
The Residue Cycle
Residue quality and amount affect how fast nutrients become available and surface
residue and SOM accumulate (Figure 1). A portion of plant residue is broken down quickly by soil biota (bacteria, fungi,
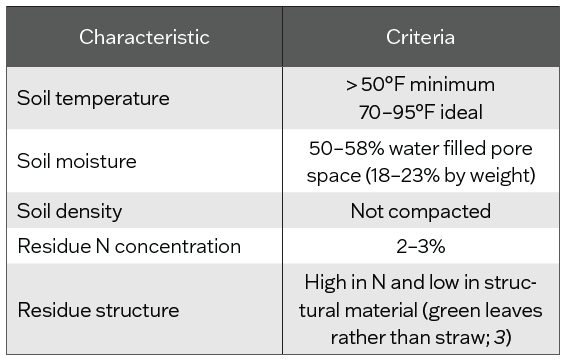
etc.) and releases plant nutrients. The rate increases with soil conditions favorable
to biological activity (Table 1), tillage (4, MT), and high residue N content (greater than around 2%, C:N less than around 20:1).
Rapid residue decomposition can supply a flush of N that can be lost to leaching in
wet years if no crop is in place to use it (5, AB).
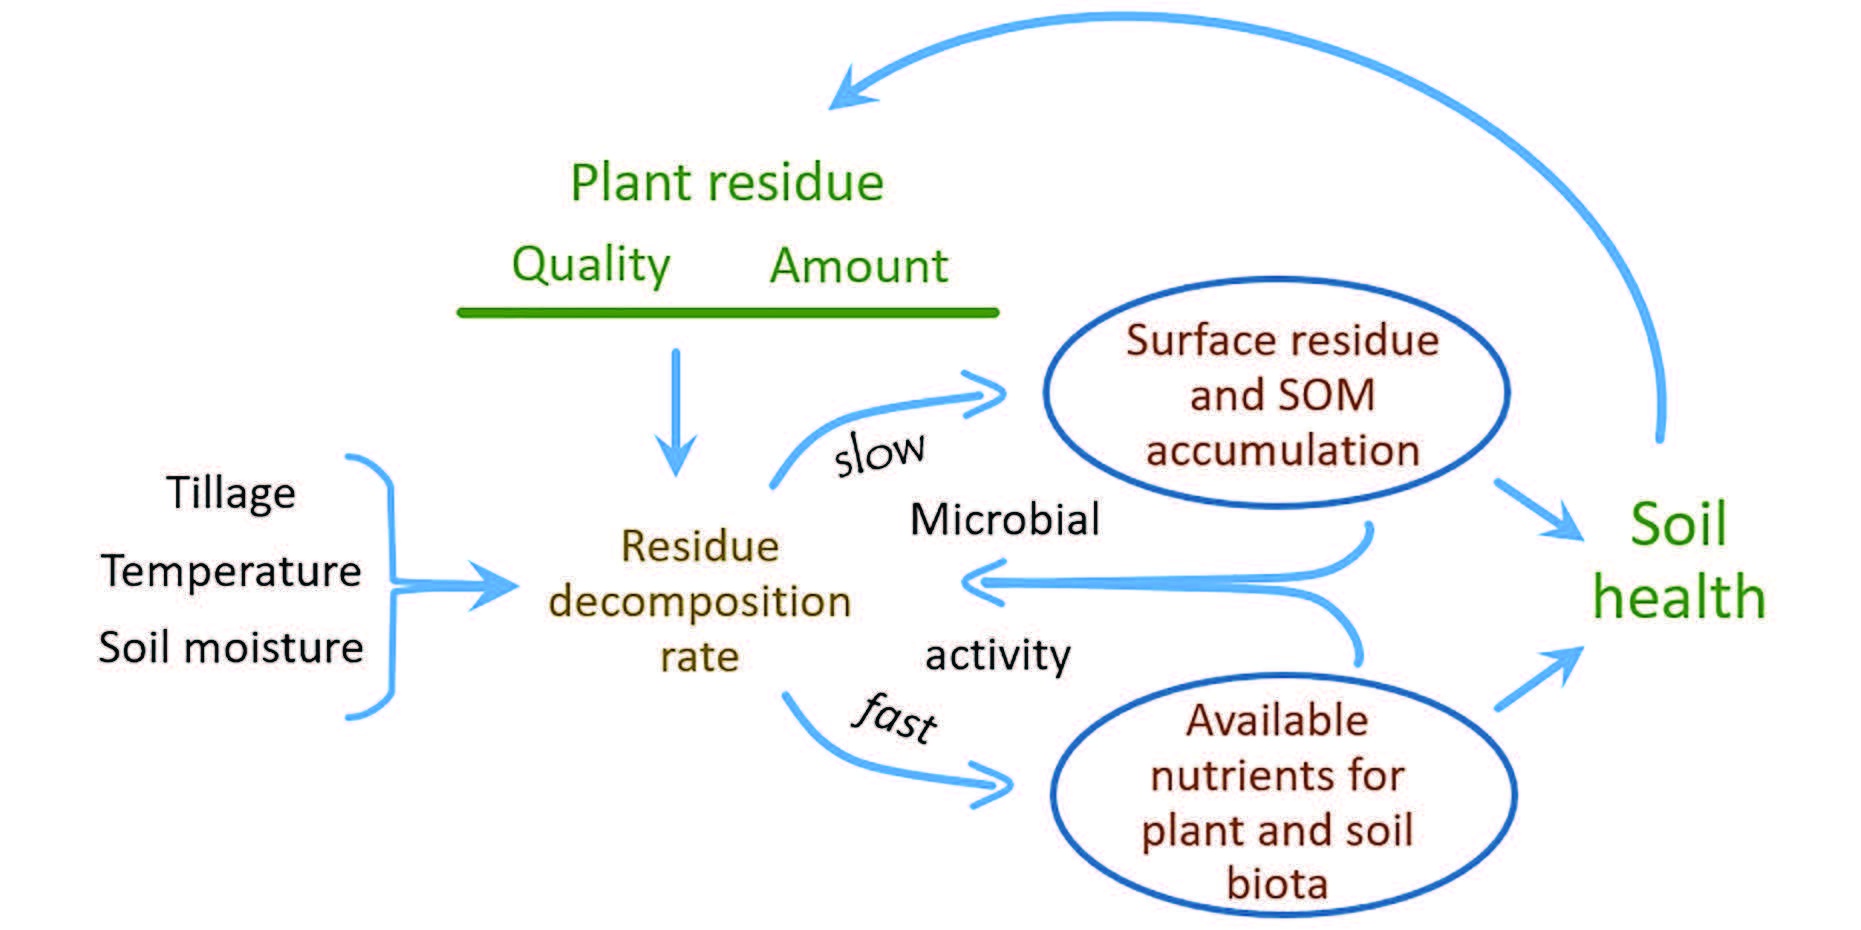
Figure 1. The relationship among plant residue quality and quantity, and microbial activity
that leads to soil health, which increases plant production and hence residue.
Table 1. Soil and residue characteristics for fast microbial decomposition of plant residue (2).
A part of the residue decomposes slowly if soil environmental conditions are not favorable
for microbial activity (e.g., dry, temperature less than 50°F, compact, toxins) and/or
the residue is low in N (less than around 2%, C:N greater than around 20:1) and high
in structural compounds (e.g., cellulose, lignin; 6). This residue may take two to three years to decompose, but eventually decomposition
reaches a steady-state where, for example, 3-year-old small grain stubble is decomposing
on-site while the current year small grain stubble will feed the system in three years.
If residue is low in N, microbial population growth is limited by N which slows decomposition
and the microbes ‘borrow’ N from the soil (immobilization), leaving less for the crop.
Nitrogen immobilization is temporary, because when the microbes die they decompose
and the N is again available for plants.
The decomposed microbes and plant residue form the humus (also called stable organic
matter) portion of SOM. Humus makes up around half of SOM. It decomposes very slowly
and is important for soil health through soil structure (aggregation), infiltration,
tilth, cation exchange capacity, resistance to pH change, and providing nutrients
for plant uptake. In the timeframe of building humus, it does not matter whether the
C comes from recent legume cover residue, or from small grain stubble that is three
years old. The total amount of C added to the system largely determines humus and
SOM accumulation (7). Because residue low in N is slower to decompose and produces fewer soil microbes,
it takes longer to become humus than residue high in N (Cover Crops: Soil Health). Plant residue is the food that drives the system that builds humus.
Cover benefits need to be viewed within the whole farm system, or at least across
all rotations on a given field, meaning the cover – cash crop rotation. A balance
between residue build up and decomposition can be accomplished by timing cover crop
termination. Young plants decompose quickly because they have higher N concentration
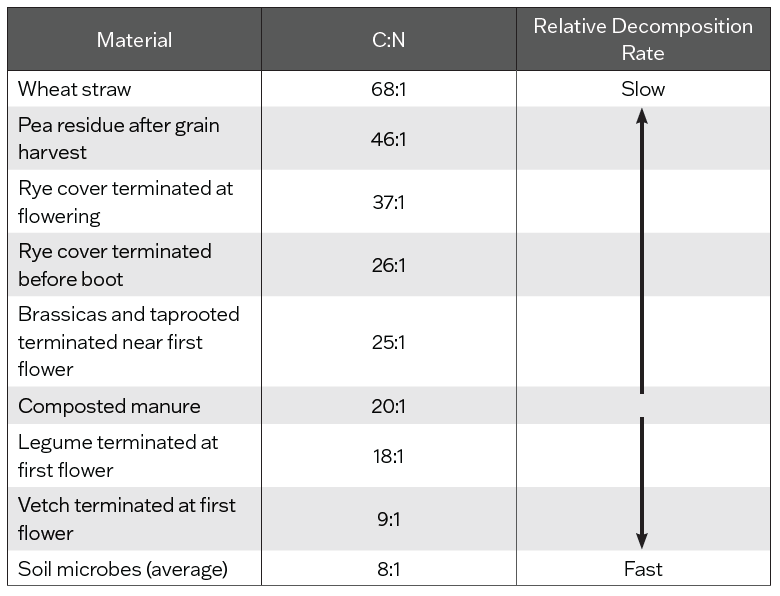
and fewer structural compounds. Planting cover crop mixes with a range of C:N ratios
(Table 2; 12) or alternating high vs. low N concentration crops over years will also balance residue
build up and decomposition. Because residue from cash crops that follow cover crops
almost always have high C:N (e.g., small grain straw C:N = 68), the focus of cover management can be to supply N.
Table 2. Approximate carbon to nitrogen ratio of various materials (8, 9, 10, 11).
Building SOM
Building SOM is slow; after 10 years of an alfalfa-grass or no-till recrop in Montana, SOM only climbed from an initial level of 1.40% to a final level of 1.47% in the top foot (13). In an extensive Saskatchewan study across tilled and no-till systems, SOM increased 0.11% SOM over 22 years (14). The probability of SOM gain is greater when initial SOM is less than 3% (Figure 2).
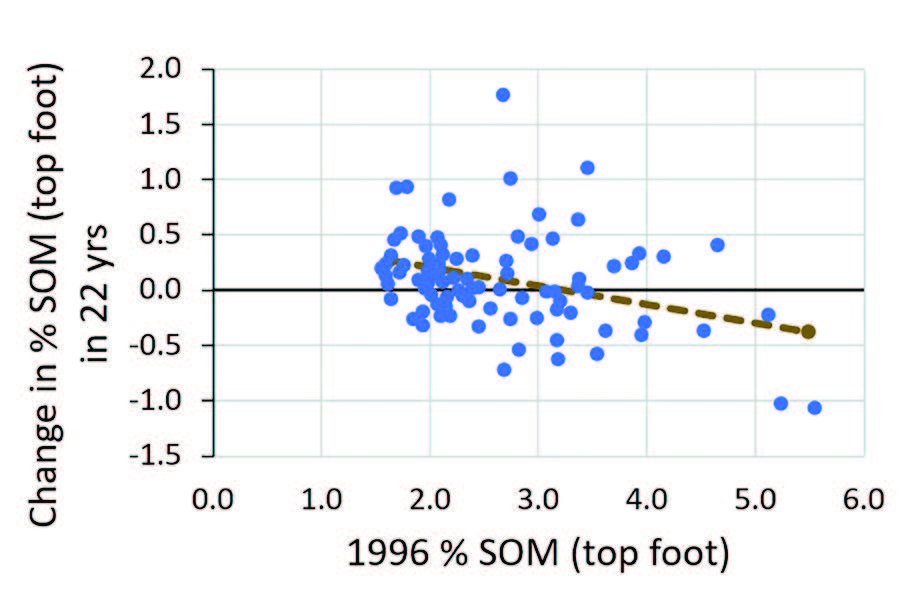
Figure 2. Change in % SOM over 22 years relative to initial %SOM for 43 semi-arid dryland fields across rotation and tillage systems (14, SK).
Residue amount
Based on a long-term Montana dryland cropping study, for each ton of above ground
residue, about 0.4 ton of SOM is formed (Figure 3). The remaining 0.6 ton is used as energy by soil microbes and lost as carbon dioxide
to the air. Soil organic matter can only build when residue input is greater than
soil microbial appetite for fresh residue and existing SOM.
In a 10-year Montana study (no-till) and a 10-year Saskatchewan study (no-till and
conservation till), SOM was maintained with 1.8 ton/acre/year dry above ground biomass
input in silt loam soils (Figure 3;15, SK).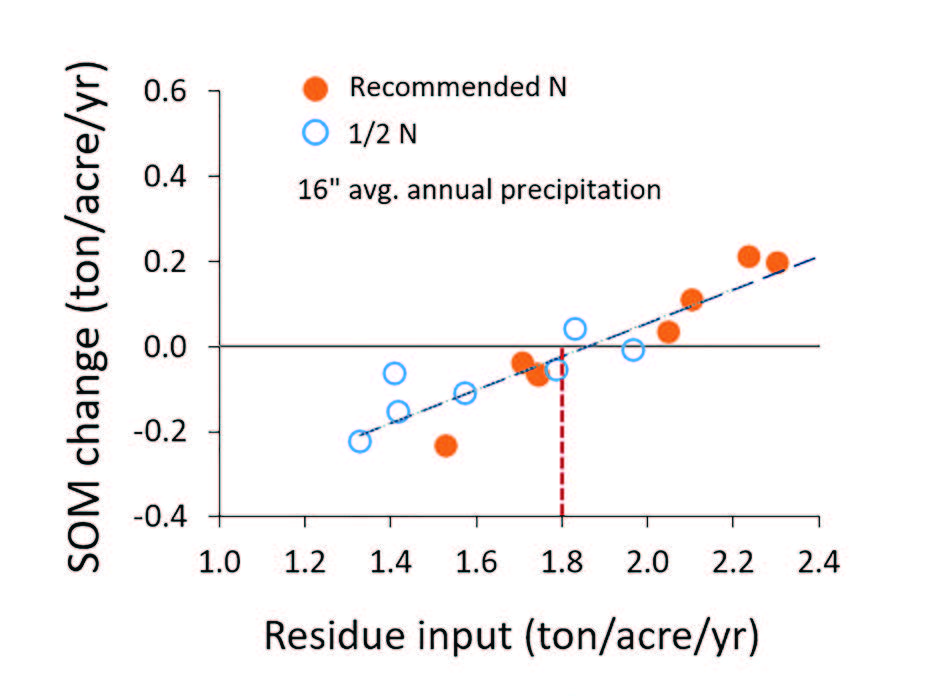
Figure 3. Average annual SOM change in top foot over 10 years relative to annual above ground residue input at two N fertilization levels (13, MT).
The 1.8 ton/acre/year threshold is an annual average over several years. For example,
36 bu/acre continuous winter wheat, 72 bu/acre winter wheat-fallow, or one ton cover
crop biomass plus 56 bu/acre winter wheat the following year are all rotations that
could lead to 1.8 ton/acre/year residue.
These production levels can be challenging to meet, especially the crop-fallow yield,
which is why it is nearly impossible to build SOM with fallow in rotation. Over 10
years, fallow-wheat lost 2.5 ton SOM/acre, pea cover-wheat maintained SOM, and continuous
wheat and pea for grain-wheat gained 1.2 ton SOM/acre (13, MT). The Montana and Saskatchewan studies were in relatively high production regions
(13 to 16-inch average annual precipitation) of the northern Great Plains. It is likely
that in locations with less than 13-inch annual precipitation, the break-even amount
is lower than 1.8 ton/acre/year because of lower decomposition rates of SOM and residue.
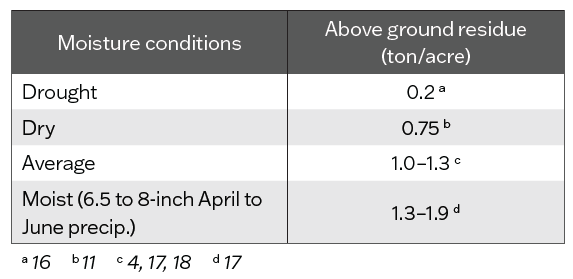
Semi-arid dryland covers produce low residue (Table 3), and both cash-crops and covers on a given field need to be included in the residue
calculations. Covers can only increase organic matter if their residue is greater
than the loss of small grain straw caused by soil water used to grow the cover. In
wet years or locations with around 6-inch growing season precipitation (April through
June), a 2-year cycle of early terminated covers and wheat can return more residue
than fallow-wheat (4, MT) although still at an immediate loss in cash crop revenue. However, in dry years
or locations, there is the risk that even early terminated cover crop-wheat will not
produce substantially more biomass over a 2-year cycle than fallow-wheat (11, 16, both MT).
Table 3. Above ground legume cover residue produced as partial fallow in Montana.
Growing covers to pod or seed set increases cover biomass by a small amount, but can
greatly reduce the following wheat yield due to water use (Table 4). Lower wheat yields produce less stubble. The net 2-year residue gain to a cover-small
grain system may actually be less if covers are grown beyond early flower, or when
followed by a dry year, and with large loss of subsequent crop yield and revenue.
The impact of cover crop biomass on subsequent wheat production is discussed in Cover Crops: Soil Water and Small Grain Yield and Protein.
Table 4. The effect of cover termination timing on cover residue, subsequent wheat yield
and stubble, and net 2-year residue input compared to fallow.
If increasing SOM is the major goal of a cover, good agronomic practices such as N,
phosphorus, and sulfur management should be used (23, OR). For example, reducing N to half the recommended rates across several cropping
systems generally reduced residue inputs to levels leading to SOM loss in a 16-inch
annual precipitation site, rather than gain (Figure 3). However, at two drier cover crop sites (12 to 14-inch annual precipitation), SOM
did not increase with higher N rate, likely because water limited biomass more than
N, and/or higher N reduced root production (7, MT).
Diversity
Theory based on ecological principles in native perennial systems and research in
wetter regions suggests mixed covers have more efficient water and nutrient use and
would produce more biomass than single species covers (24). However, in general, in semi-arid dryland systems, the number of species does not
greatly affect average cover crop biomass (20, 25, both MT).
In regions with unreliable precipitation, the key is to select single or mixed species
with reliable and acceptable biomass production (25, MT). In a review of monoculture versus mixed species covers, well-suited single
specie covers usually produced more biomass than the multi-species mix (26). While a pea cover
monoculture might produce good yield and protein in subsequent crop, it can be riskier
to plant just one cover (if for example eaten by pea leaf weevil, or gets diseased).
Also, pulse cover monoculture can limit a producer’s pulse-grain growing options for
crop insurance reasons. Mixes may be more expensive and challenging to seed compared
to a single species (27, CO). However, mixes provide a better chance something will grow well and that biomass
will be more consistent across growing seasons (25, MT). The total residue produced over three years varied by 8% among four unique
6-species blends, and by 25% among four 2-species blends, but none of the 2- or 6-
species mixes produced more biomass than pea alone (20, MT).
Including legumes in the cover may be key. The total residue returned by alternating
early terminated cover crop with wheat over four cycles was 10 to 40% greater when
cover crops contained legumes than not (two Montana locations). Including legumes
was more important when the intervening wheat rotation received little or no N fertilizer
(Figure 4). This agrees with others who found adding legumes can increase cover crop biomass
in low-N soils (28, MI).
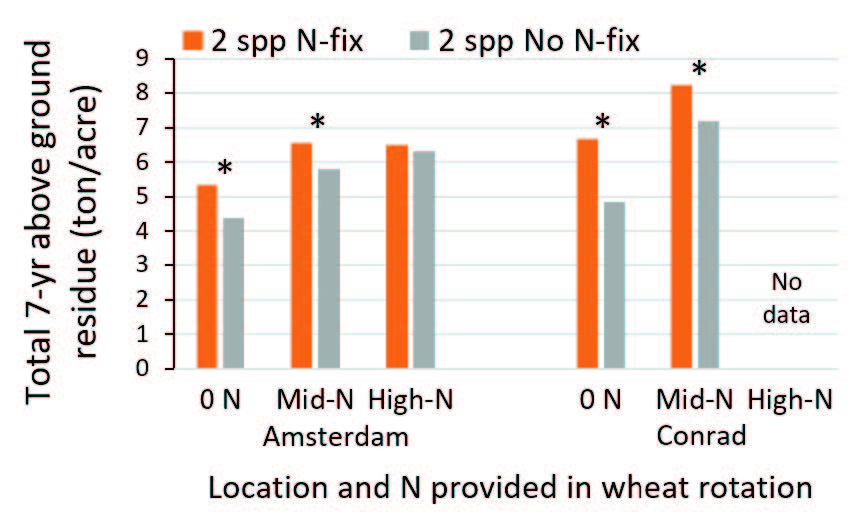
Figure 4. Total above ground biomass from cover and alternate year wheat residue at two Montana locations and different levels of wheat N fertilization. The cover was either two legume species or 2-non-legume species mixes. * indicates 99% confidence of difference between cover crops within a location and N level (20).
Timing
Timing of seeding should be selected to optimize growth based on climate. For cool
season cover crops as partial- to full-fallow replacement in the northern Great Plains,
this generally means seeding in early to mid-spring. Warm season covers grazed in
late summer or fall are an emerging practice as fallow replacement. We do not have
data on how they affect soil water and subsequent wheat yields. The goals and economics
of grazed covers are potentially very different from ungrazed covers discussed in
this bulletin. Late summer/fall seeded covers have not been common in dryland systems
in semi-arid
regions because of generally low and highly unpredictable precipitation for establishment
(29, ND).
Terminating cover crops by small-grain boot, or legume by early- to mid-flower stage
preserves soil water for the next crop. Also, the contribution to SOM by roots is
similar between early and late terminated covers (30, 31, both SK). Roots are an important source of long-term carbon toward building SOM.
Even though shoots may produce two to three times more biomass than roots, root carbon
stays in the soil 2.5 times longer than shoot carbon (30).
If soil moisture is less of a limiting factor (e.g., irrigated systems), more soil
improvements are realized with full- rather than partial-season and over-winter than
spring cover crops (33, ND; 34, MT). In a northern Montana dryland system, winter pea (relative to spring pea) grown
as a partial-summer fallow produced higher residue and had less weed biomass, used
less soil water, contributed greater soil N, and increased subsequent winter wheat
grain yield and protein concentration (34). However, low fall moisture, winter kill, or soggy spring soil are obstacles to growing
winter pea in Montana (35).
Nitrogen
Cover crops can add available N when legumes are included and maintain available soil
N by trapping residual N (catch and release N). Although legumes can fix N, they are
good soil N scavengers, so they do not always increase spring plant available N (PAN)
compared to fallow (Cover Crops: Soil Water and Small Grain Yield and Protein). If available soil N is high, there is no N gain from legumes (26, MI) because they do not fix much N when N is readily available. See Inoculation
and nitrogen management to optimize pulse crop yield and protein for practices that
can improve bacterial nodulation and N fixation.
Plant available N contributed by covers is highly related to the total amount of N
in the above and below ground plant residue, and the rate of decomposition (Table 1). In cool, dry, no-till systems with slow decomposition, potentially mineralizable
N (PMN, the N in organic material that can become plant available during the growing
season) slowly builds up in the form of SOM. After four cycles of no-till pulse cover
alternating with wheat, the PMN was 1.5 times that
found in fallow-wheat systems (36, MT). In another Montana dryland system, lentil cover-wheat had the same nitrate
levels as the fallow system after three cycles (6-years; 37).
Diversity
The amount of N fixed varies greatly by legume species. Field pea has potential to
contribute high amounts of N; the amount depends partially on soil moisture. Nitrogen
fixation by pea terminated at flower in a dry year (75 lb N/acre) was much higher
than lentil (31 lb N/acre; 38, MT). Although biomass continued to increase from flower to pod stage, pea did not
fix more N, while lentil continued to fix N (up to 80 lb N/acre). In contrast, in
a wet year, pea continued to fix N from flower (94 lb N/acre) to pod (121 lb N/acre).
Plant available N is high (after substantial cover crop decomposition) when the cover
crop biomass is 75 to 100% legume and low if legumes make up less than 25% (Figure 5). A minimum of 40% legume biomass in a mixture has been suggested to supply, rather
than tie up, N in soils following cover crops (40, greenhouse).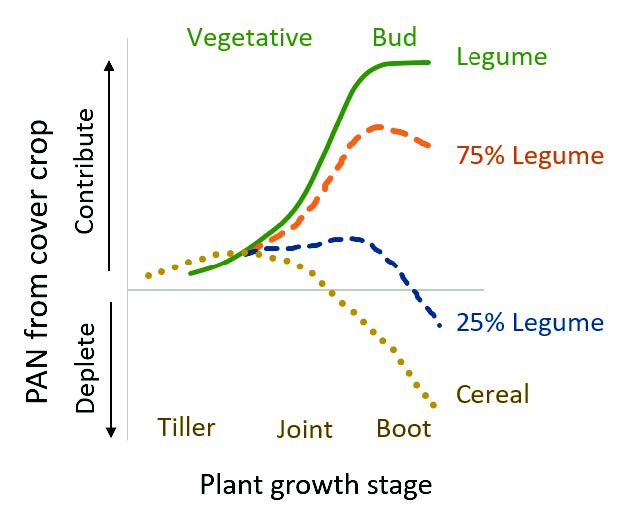
Figure 5. Plant available N (PAN) by cover crop legume content and plant stage at termination (39, OR)
Roots are also an important source of PAN; the N contribution varies by species (41). Most annual crops’ root biomass is less than shoot biomass (42). However, roots contribute a lot of N during the growing season via natural root
turn-over (death and replacement) and rhizodeposition (materials released from roots).
These N sources are missed if only present roots are counted. Plant below ground N
is difficult to estimate, yet often represents a higher proportion of the next crop’s
N uptake than shoot N (43, SK). Since the amount of N provided by roots can be significant, soil testing is
important.
The Oregon State University Cover Crop Calculator is a spreadsheet tool to estimate N made available over a typical season based on
cover crop biomass and N content. Nitrogen concentration can be determined through
plant tissue analysis by a laboratory. There is also potential to use hand-held NDVI
meters (44, PA) or drone imagery to estimate cover crop biomass N content in the field.
“Ideal” species and mixes will change depending on goals, location, and year. If selecting
cover species based on a combination of biomass amount and consistency, soil N contribution,
and water use, two- and three-way mixes containing pea, barley, and safflower were
desirable in both a dry and average growing season (25, MT).
Until more studies are completed, results from experienced cover crop growers and
on-farm strip trials are a good resource.
Crop diversity over time (different crops each year) can be used instead of, or in
combination with, planting cover mixes to increase SOM or PMN (45, PA). The Northern Great Plains Research Lab Cover Crop Chart provides information on cover species’ water use, plant shape, salinity tolerance
and other characteristics that help determine their suitability for a specific cropping
system and goal. The Northern Great Plains Research Lab Crop Sequence Calculator provides additional information on how species affect each other in succession.
Timing
Regardless of species, terminating cover crops by boot or early- to mid-flower stage
kills plants when they are low in C:N (even grasses, 17, 18, both MT), and provides more PAN more quickly than mature plant material (Figure 6; Table 2). To maximize PAN, terminate cereal cover crops early (before stem elongation, jointing).
Cereals terminated at flag leaf provide little PAN and if terminated after flag leaf,
residue N is likely tied up by microbes (46, AL). Legumes terminated early not only have lower C:N, but also use less soil N
(and water) and have more time to decompose, leading to more N for the next crop than
when terminated at maturity (11, MT).
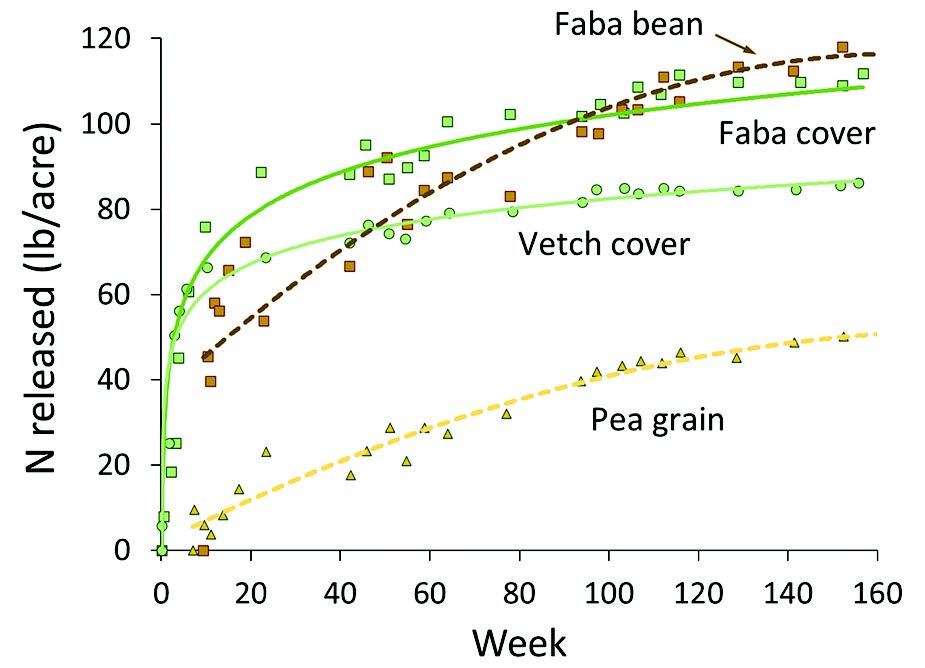
Figure 6. Pounds of N released from above ground cover and mature pulse crop residue over time. Cover was cut at full bloom (9, AB).
A balance is needed between timing N release for the next crop, yet retaining N until
after overwinter/early spring potential leaching loss and when new crop roots are
in place to take up the released N. Replacing fallow with cover crops reduces N leaching
potential (47). If there is fall precipitation, a late summer cover crop is an option to catch residual
soil N (29, ND). A fall planted cover crop that winter kills (e.g., radish) or partial-fallow
cover often increases spring soil N, whereas an overwinter cover crop terminated in
the spring (e.g., rye) may decompose too slowly to supply N for a spring crop (48, AB). See Minimizing Nitrate Leaching from Cropland b/c Crop and Fertilizer Management Practices to Minimize Nitrate Leaching for more information on preventing N leaching.
Summary
To increase SOM and soil N with cover crops, select species and termination timing and method to fit that objective. Based on the few regional medium- and long-term studies available:
- It takes years to increase SOM.
- Covers as partial-fallow replacement may not increase the whole systems residue input if subsequent cash crop yields are substantially reduced due to cover crop soil water use.
- Higher number of species in cover crop mix does not consistently improve SOM more than a healthy pea cover crop, although mixes are more resilient to poor or failed growth in any given year.
- Seed selection should be based on desired goals, such as biomass, or N provided, and then on seed cost.
- Cover crops can be used to fill in gaps in rotation and add diversity.
- Legumes need to comprise more than 40% of a cover crop biomass to contribute soil available N.
- Early rather than late termination of partial-fallow covers increases residue N concentration and limits the reduction of the following cash crop yields, thus loss of cash crop residue.
Cover crops can be a wonderful tool to build SOM and PAN if you can maintain overall productivity and profitability of the cash crop. In low precipitation regions this can be a challenge. When including covers, make choices that fit into the overall production system, and actively manage for a robust cover crop to accomplish the specific goal. Start small, consult with others, and make modifications to current management that are workable.
Acknowledgements
We thank the Western Sustainable Agriculture Research and Education (WSARE) program and the Montana Fertilizer Advisory Committee for funding MSU studies, and Kari Lewis (MSU Extension agent), Luke Ahlman (Certified Crop Adviser), Carl Vander Molen (Producer), and MSU Communications for their time and expertise in reviewing and producing this bulletin.
References
- Archer, D., M.A. Liebig, J. Hendrickson, D. Tanaka, M.R. Schmer, and K.A. Nichols. 2017. Short-Term economics of late-seeded cover crops in a semi-arid environment. American Soc. Agron. annual meeting, Oct 22-25, 2017, Tampa, Florida. https://scisoc.confex.com/scisoc/2017am/webprogram/Paper105653.html
- Vigil, M., and D. Sparks. 1995. Factors Affecting the Rate of Crop Residue Decomposition under Field Conditions. Conservation Tillage Fact Sheet #3-95. USDA-ARS, UDSA-NRCS.
- Ruark, M. 2020. Nitrogen availability from cover crops: Is it always about the C:N ratio? Crops & Soils, Jan-Feb.
https://doi.org/10.1002/crso.20003 - Burgess, M., P. Miller, C. Jones, and A. Bekkerman. 2014. Tillage of cover crops affects soil water, nitrogen, and wheat yield components. Agron. J. 106:1497–508. https://doi.org/10.2134/agronj14.0007
- Burgess, M., P. Miller, C. Jones, and A. Bekkerman. 2014. Tillage of cover crops affects soil water, nitrogen, and wheat yield components. Agron. J. 106:1497–508. https://doi.org/10.2134/agronj14.0007
- Kumar, K., and K.M. Goh. 1999. Crop residues and management practices: effects on soil quality, soil nitrogen dynamics, crop yield, and nitrogen recovery. Adv. Agron. 68:197-319. https://doi.org/10.1016/S0065-2113(08)60846-9
- Jones, C., K. D’Agati, M. Housman, S. Tallman, P.R. Miller, and C. Zabinski. 2021. Is Cover Crop Species Richness More Important at Building Soil Health Than Shoot Biomass in a Semi-Arid Region? Proceedings Western Nutrient Management Conference. March 2021.
- D’Agati, K. 2020. Soil Response to Long Term Multispecies Cover Crop Mixes and Above
Ground Biomass, in the Semi-arid Northern Great Plains. MS Thesis. Montana State University.
102 p.
https://scholarworks.montana.edu/handle/1/16036 - Lupwayi, N.Z., and Y.K. Soon. 2015. Carbon and Nitrogen Release from Legume Crop Residues for Three Subsequent Crops. Soil Sci. Soc. Am. J. 79:1650-2659. https://doi.org/10.2136/sssaj2015.05.0198
- USDA, NRCS. 2011. Carbon to Nitrogen Ratios in Cropping Systems.
https://docslib.org/doc/7162829/carbon-to-nitrogen-ratios-in-cropping-systems
- Miller, P., R.E. Engel, and J.A. Holmes. 2006. Cropping sequence effect of pea and pea management on spring wheat in the northern Great Plains. Agron. J. 98:1610–1619. https://doi.org/10.2134/agronj2005.0302
- McDaniel, M.D., A.S. Grandy, L.K. Tiemann, and M.N. Weintraub. 2014. Crop rotation complexity regulates the decomposition of high and low quality residues. Soil Biol. Biochem. 78:243-254. https://doi.org/10.1016/j.soilbio.2014.07.027
- Engel, R.E., P.R. Miller, B.C. McConkey, R. Wallender, and J.A. Holmes. 2017. Soil organic C changes to ten years of increasing cropping system intensity and no-till in a semiarid climate. Soil Sci. Soc. Am. J. 81:404-413. https://doi.org/10.2136/sssaj2016.06.0194
- McConkey, B., M. St. Luce, B. Grant, W. Smith, A. Anderson, G. Padbury, K. Brandt, and D. Cerkowniak. 2020. Prairie Soil Carbon Balance Project: Monitoring SOC Change Across Saskatchewan Farms from 1996 to 2018. Saskatchewan Soil Conservation Association.
- Shrestha, B.M., B.G. McConkey, W.N. Smith, R.L. Desjardins, C.A. Campbell, B.B. Grant, and P.R. Miller. 2013. Effects of crop rotation, crop type and tillage on soil organic carbon in a semiarid climate. Can. J. Soil Sci. 93:137-146. https://doi.org/10.4141/CJSS2012-078
- O’Dea, J.K., P.R. Miller, and C.A. Jones. 2013. Greening summer fallow with legume green manures: On-farm assessment in north-central Montana. J. Soil Water Conserv. 68:270-282. https://doi.org/10.2489/jswc.68.4.270
- Housman, M. 2016. Multi-species Cover Crops in the Northern Great Plains:An Ecological Perspective on Biodiversity and Soil Health. MS Thesis. Montana State University. 161 p. https://scholarworks.montana.edu/items/df012e68-b434-4d0d-86cf-0137b732a3eb/full
- Tallman, S. 2014. Cover Crop Mixtures as Partial Summer fallow Replacement in the Semi-arid Northern Great Plains. MS Thesis. Montana State University. 147 p. https://scholarworks. montana.edu/xmlui/handle/1/3388
- Miller, P., C. Jones, C. Zabinski, J. Norton, S. Tallman, and M. Housman. 2016. Using cover crop mixtures to improve soil health in low rainfall areas of the northern plains. Final Report. 40 pp. https://projects.sare.org/sare_project/sw11-099/
- Miller, P. Unpublished data
- Burgess, M. 2012. Sustainable Cropping Systems for the Northern Great Plains – Energetic and Economic Considerations. PhD Dissertation. Montana State University. 232 p.
- Zentner, R.P., C.A. Campbell, V.O. Biederbeck, F. Selles, R. Lemke, P.G. Jefferson, and Y. Gan. 2004. Long-term assessment of management of an annual legume green manure crop for fallow replacement in the Brown soil zone. Can. J. Plant Sci. 84:11-22. https://doi.org/10.4141/P02-188
- Wuest, S.B., and C.L. Reardon. 2016. Surface and root inputs produce different carbon/phosphorus ratios in soil. Soil Sci. Soc. Am. J. 80:463–471. https://doi.org/10.2136/sssaj2015.09.0334
- Malézieux, E., Y. Crozat, C. Dupraz, M. Laurans, D. Makowski, H. Ozier-Lafontaine, B. Rapidel, S. de Tourdonnet, and M. Valantin-Morison. 2009. Mixing plant species in cropping systems: concepts, tools and models. A review. Agron. Sustain. Dev. 29:43-62. https://doi.org/10.1051/agro:2007057
- Khan, Q., and K. McVay. 2019. Productivity and stability of multi-species cover crop mixtures in the northern Great Plains. Agron. J. 111:1817-1827. https://doi.org/10.2134/agronj2018.03.0173
- McGuire, A. 2015. Monoculture vs. polyculture part 1: “Straight up” beats “cocktails” for cover crop productivity. https://csanr.wsu.edu/monoculture-vs-polyculture-part-i/
- Nielsen, D.C., D.J. Lyon, G.W. Hergert, R.K. Higgins, and J.D. Holman. 2015. Cover crop biomass production and water use inthe central Great Plains. Agron. J. 107:2047-2058. https://doi.org/10.2134/agronj15.0186
- Hayden, Z., M. Ngouajio, and D. Brainard. 2014. Rye–vetch mixture proportion tradeoffs: Cover crop productivity, nitrogen accumulation, and weed suppression. Agron. J. 106: 904-914. http://doi.org/10.2134/agronj2013.0467
- Liebig, M., J.R. Hendrickson, D.W. Archer, M.A. Schmer, K.A. Nichols, and D.L. Tanaka. 2015. Short-term soil responses to late-seeded cover crops in a semi-arid environment. Agron. J. 107:2011-2019. https://doi.org/10.2134/agronj15.0146
- Rasse, D.P., C. Rumpel, and M.F. Dignac. 2005. Is soil carbon mostly root carbon? Mechanisms for a specific stabilization. Plant Soil. 269:341-356. https://doi.org/10.1007/s11104-004-0907-y
- Gan, Y.T., C.A. Campbell, H.H. Janzen, R. Lemke, L.P. Liu, P. Basnyat, and C.L. McDonald. 2009. Root mass for oilseed and pulse crops: Growth and distribution in the soil profile. Can. J. Plant Sci. 89:83-893. https://doi.org/10.4141/CJPS08154
- Liu, L., Y. Gan, R. Bueckert, and K. Van Rees. 2011. Rooting systems of oilseed and pulse crops I: Temporal growth patterns across the plant developmental periods. Field Crops Res. 122:256-263. https://doi.org/10.1016/j.fcr.2011.04.002
- Liebig, M., V. Acosta-Martinez, D.W. Archer, J. Hendrickson, S. Kronberg, and S. Samson-Liebig. 2017. ASA. Soil quality outcomes from dryland cropping systems: comparison of conservation and business as usual practices. American Soc. Agron. annual meeting. October 22-25, 2017, Tampa, Florida. https://scisoc.confex.com/scisoc/2017am/webprogram/Paper105232.html
- Miller, P.R., E.J. Lighthiser, C.A. Jones, J.A. Holmes, T.L. Rick, and J.M. Wraith. 2011. Pea green manure management affects of organic winter wheat yield and quality in semiarid Montana. Can. J. Plant Sci. 91: 497-508. https://doi.org/10.4141/CJPS10109
- Miller, P. Personal observation.
- O’Dea, J.K., C. Jones, C. Zabinski, P. Miller, and I. Keren. 2015. Legume, cropping intensity, and N-fertilization effects on soil attributes and processes from an eight-year-old semiarid wheat system. Nutr. Cycl. Agroecoysyst. 102:179-194. https://doi.org/10.1007/s10705-015-9687-4
- Allen, B.L., J.L. Pikul, J.T. Waddell, and V.L. Cochran. 2011. Long-term lentil green- manure replacement for fallow in the semiarid northern Great Plains. Agron. J. 103:1292-1298. https://doi.org/10.2134/agronj2010.0410
- McCauley, A., C. Jones, P. Miller, P., M. Burgess, and C. Zabinski. 2012. Nitrogen fixation by pea and lentil green manures in a semi-arid cropping system: effect of planting and termination time. Nutr. Cycl. Agroecosys. 92:305-314. https://doi.org/10.1007/s10705-012-9491-3
- Sullivan, D.M, and N.D. Andrews. 2012. Estimating Plantavailable Nitrogen Release from Cover Crops. https://catalog.extension.oregonstate.edu/pnw636
- Kuo, S., and U.M. Sainju. 1998. Nitrogen mineralization and availability of mixed leguminous and non-leguminous cover crop residues in soil. Biol. Fertil. Soils 26:346-353. https://doi.org/10.1007/s003740050387
- Anglade, J., G. Billen, and J. Garnier. 2015. Relationships for estimating N2 fixation in legumes: incidence for N balance of legume-based cropping systems in Europe. Ecosphere 6:37. http://dx.doi.org/10.1890/ES14-00353.1
- Thiagarajan, A., J. Fan, B. McConkey, H. Janzen, and C. Campbell. 2018. Dry matter partitioning and residue N content for 11 major field crops in Canada adjusted for rooting depth and yield. Can. J. Soil Sci. 98: 574–579. https://doi.org/10.1139/cjss-2017-0144
- Arcand, M.M, R. Lemke, R.E. Farrell, and J. D. Knight. 2014. Nitrogen supply from belowground residues of lentil and wheat to a subsequent wheat crop. Biol. Fert. Soils 50:507-515. https://doi.org/10.1007/s00374-013-0873-8
- White, C., B. Bradley, D. Finney, and J. Kaye. 2019. Predicting cover crop nitrogen content with a handheld normalized difference vegetation index meter. Agriculture & Environmental Letters. Vol 4. https://doi.org/10.2134/ael2019.08.0031
- Hunter, M., M. Schipanski, M. Burgess, J. LaChance, B. Bradley, M. Barbercheck, J. Kaye, and D. Mortensen. 2019. Cover crop mixture effects on maize, soybean, and wheat yield in rotation. Agriculture & Environmental Letters 4:UNSP 180051. https://doi.org/10.2134/ael2018.10.0051
- Ashford, D.L., and D.W. Reeves. 2003. Use of a mechanical roller-crimper as an alternative kill method for cover crops. Am. J. Alt. Ag. 18:37-45. https://www.jstor.org/stable/44503245
- Tonitto, C., M.B. David, and L.E. Drinkwater. 2006. Replacing bare fallow with cover crops in fertilizer-intensive cropping systems: a meta-analysis of crop yield and N dynamics. Agric. Ecosyst. Environ. 112:58-72. https://doi.org/10.1016/j.agee.2005.07.003
- Thomas, B.W., F.J. Larney, M.H. Chantigny, C.Gloyer, and X. Hao. 2017. Fall rye reduced residual soil nitrate and dryland spring wheat grain yield. Agron. J. 109:718-728. https://doi.org/10.2134/agronj2016.10.0616
Resources
Montana Specific
- Montana State University Extension publications are available online https://extension-store.montana.edu or call 406-994-3273.
- Cover Crops as Partial Replacement of Summer Fallow (MT202203AG)
- Cover Crops: Soil Water and Small Grain Yield and Protein (EB0236)
- Cover Crops: Soil Health (EB0238)
- Crop Fertilizer Management Practices to Minimize Nitrate Leaching (MT201103AG)
- Fertilizer Guidelines for Montana Crops (EB0161)
- Interpretation of Soil Test Reports for Agriculture (MT200702AG)
- Minimizing Nitrate Leaching from Cropland (EB0226)
- Montana Cool-Season Pulse Production Guide (EB0210)
- Inoculation and nitrogen management to optimize pulse crop yield and protein. Crops & Soils. July 2018. https://doi.org/10.2134/cs2018.51.0405
- The Soil Scoop https://landresources.montana.edu/soilfertility/soilscoop
- Evaluating Soil Quality and Health
- Soil Fertility for Pulse Crops
- Eastern Ag Research Center Dryland Cool and Warm Season Cover Crop Performance Evaluations. 2016 Agricultural Research Update http://agresearch.montana.edu/earc/annualreports.html
- Evaluations of Alternative Economic Endpoints of Cover Crops in Northern Montana Replacing Fallow in a Crop-Fallow Rotation. 2017. A presentation by Darrin Boss, Northern Ag Research Center https://scisoc.confex.com/scisoc/2017am/videogateway.cgi/id/32132?recordingid=32132
- USDA-NRCS Bridger Plant Materials Center Technical Notes
https://www.nrcs.usda.gov/plant-materials/mtpmc- PM-14-MT-96. Peas: An Introduced Legume for Conservation Use in Montana and Wyoming. 2014. Hybner, R. 6p. (ID# 12101)
- PM-15-MT-106. Radish: An Introduced Cover Crop for Use in Montana and Wyoming. 2015. Hybner, R. 6p. (ID# 12456)
- PM-18-MT-120. Small-seeded Fava Bean as a Cash Crop and within Cover Crop Mixture. 2017. Tallman, S. 2p. (ID# 13262)
Online tools
Cover Crop Chart. USDA-ARS Northern Great Plains Research Lab. An online or pdf version decision aid tool with information on 58 crop species https://www.ars.usda.gov/plains-area/mandan-nd/ngprl/docs/cover-crop-chart/
Cover Crops for Vegetable Growers. Cornell University. http://covercrops.cals.cornell.edu/decision-tool.php
Crop Sequence Calculator. USDA-ARS, interactive software program to design crop sequences. https://www.ars.usda.gov/plains-area/mandan-nd/ngprl/docs/crop-sequencecalculator/
Oregon State University Cover Crop Calculator to estimate N available from plant residue over a growing season. https://extension.oregonstate.edu/organic-fertilizer-cover-cropcalculators
Organizations
- Soil Health Institute https://soilhealthinstitute.org/
- Sustainable Agriculture Research & Education (SARE) https://www.sare.org/Learning-Center/Topic-Rooms/Cover-Crops
- USDA-NRCS MT environmental quality incentives program (EQIP) for cover crop incentives and advice. https://www.nrcs.usda.gov/programs-initiatives/environmental-quality-incentives-program
Copyright © 2022 MSU Extension
We encourage the use of this document for nonprofit educational purposes. This document
may be reprinted for nonprofit educational purposes if no endorsement of a commercial
product, service or company is stated or implied, and if appropriate credit is given
to the author and MSU Extension. To use these documents in electronic formats, permission
must be sought from the Extension Communications Coordinator, 115 Culbertson Hall,
Montana State
University, Bozeman, MT 59717; E-mail: publications@montana.edu
The U.S. Department of Agriculture (USDA), Montana State University and Montana State
University Extension prohibit discrimination in all of their programs and activities
on the basis of race, color, national origin, gender, religion, age, disability, political
beliefs, sexual orientation, and marital and family status. Issued in furtherance
of cooperative extension work in agriculture and home economics, acts of May 8 and
June 30, 1914, in cooperation with the U.S.
Department of Agriculture, Cody Stone, Director of Extension, Montana State University,
Bozeman, MT 59717.