


Module 3: Nitrogen Cycling, Testing and Fertilizer Recommendations
June 2005
4449-3
By Clain Jones, Extension Soil Fertility Specialist; Jeff Jacobsen, Former Professor
Department of Land Resources and Environmental Sciences
Introduction
This is the third in a series of Extension materials designed to provide pertinent
information on a variety of nutrient management, water management, and water quality
issues to Extension agents, Certified Crop Advisers (CCAs), consultants, and producers.
We have included a series of questions at the back of
this module that will make the learning “active” as well as offer the potential for
CEU credits for CCAs. In addition, we have included a resource section of other Extension
materials, books, web sites, and professionals in the field.
Objectives
- Describe the 9 major nitrogen processes that occur in soil
- Describe the major factors that affect each of the nitrogen processes
- Recognize how different crops and cropping systems affect N availability
- Understand optimum nitrate sampling depths for different conditions
- Understand how a soil nitrate test result is used to estimate N fertilizer requirements
- Calculate N fertilizer application rates
Background
Nutrient Management Module 2 discussed the 14 mineral nutrients that are required
by plants for growth and reproduction. Of these, nitrogen (N) is
generally taken up in larger amounts than the others and is the most common, and most
important, limiting nutrient for agricultural crops. Not only does N
affect yield, but it also affects the quality (protein or sugar content) of crops
such as wheat, barley, and sugar beets. In addition, N also interacts with most of
the other macronutrients. To understandhow cropping systems, N fertilizer forms, application
rates, and timing of N fertilization affect crop yield and quality,
it is important to first understand the various transformations that N undergoes within
the soil.
Nitrogen Cycling
Of all the mineral nutrients, N has the most complex nutrient cycle, largely because
N can exist as a gas (both ammonia and nitrogen gas), whereas the
other 13 mineral nutrients do not exist as gases under normal soil conditions. To
help understand the various components of the N cycle, definitions and molecular formulas
of the numerous N forms are provided in Table 1. Available N is generally considered
to be the sum of ammonium and nitrate, although urea, a type of organic N, may also
be plant available.
Nitrogen cycling consists of nine major processes: plant uptake, exchange, nitrification,
denitrification, volatilization, mineralization, immobilization, N2
fixation, and leaching (Figure 1). Each of these processes, and the effect that each
has on plant available N (and hence yield), is described below. As you read about
each of these processes, think about how each will affect the amount of nitrate and
ammonium in different soil systems because these two forms are available to plants,
and therefore, can directly affect crop yield.
Figure 1. The Nitrogen Cycle.
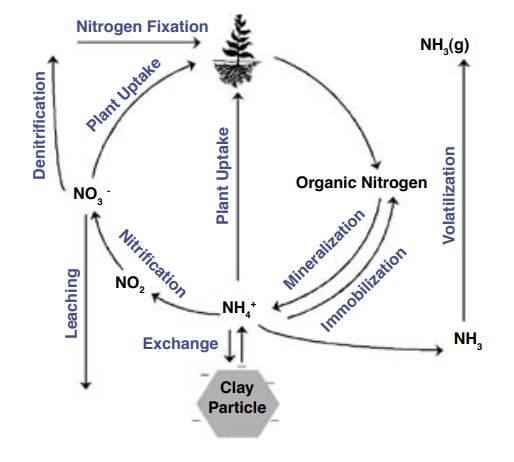
Table 1. Definitions of each N form.
| Nitrogen Form | Molecular Formula | Notes |
| Nitrogen gas | N2 (g) | Represents about 80% of the air we breathe |
| Ammonia gas | NH3 (g) | Generally cheapest form of N, toxic at high concentrations |
| Ammonium | NH4+ | Plant available, attracted to exchange sites on clay particles |
| Nitrate | NO3- | Very mobile, requires more energy by plant than ammonium |
| Nitrite | NO2- | Mobile, generally low concentrations, toxic to young mammals |
| Organic N | - | Slowly supplies available N to soil solution |
Plant Uptake
Annual crop uptake of N can vary from approximately 50 to 200 lb/ac per year, depending
on crop and yield (Table 2). N uptake can be estimated by dividing a
grower’s yield by the yield shown in the table, and then multiplying this amount by
the N uptake. A more accurate approach is to multiply plant tissue N content (as a
fraction) by dry yield (in lb/ac). It’s useful to compare actual uptake rates to N
fertilizer rates, because N fertilizer rates that are much higher (two-fold or
more) than N uptake suggest an excessive loss of N and a possible need to refine N
application rates or management practices. The amount of N uptake will be
largely controlled by the concentration of available N in the soil, a quantity that
is controlled by the processes described below.
Table 2. N uptake in harvested portions of selected agricultural crops.
| Crop | Assumed Yield Per Acre | N Uptake (lb/ac) |
| Alfalfa | 2.5 t | 150 |
| Barley | 50 bu | 80 |
| Brome | 1.5 t | 66 |
| Corn silage | 20 t | 167 |
| Oats | 60 bu | 70 |
| Orchard grass | 1.5 t | 75 |
| Potatoes | 300 cwt | 162 |
| Sugar beets | 25 t | 210 |
| Timothy | 1.5 t | 56 |
| Wheat | 40 bu | 70 |
Adapted from CFA (1995).
Exchange
Cation exchange was described in Nutrient Management Module 2. Briefly, ‘exchange’ indicates that ions (charged molecules) are attracted to a soil
surface.
Because clays generally have negative charges, and ammonium (NH4+) has a positive charge, it will be attracted to, and held weakly on clay particles.
The general term for this process is ‘sorption,’ which prevents ammonium from moving
very rapidly through the soil. Although it may seem that the ammonium would not be
available for plant uptake, ammonium can move away from the soil surface as ammonium
levels decrease in soil solution due to the process known as diffusion (see NM Module 2). Hence, there is an exchange of ammonium between soil and soil solution. More ammonium
is held by high pH (neutral to alkaline) soils, and conversely, ammonium moves more
readily in low pH (acidic) soils.
The two negatively charged N forms (nitrate and nitrite) will be repelled from negative
charges on the clay surface, and are not attracted very strongly to the
fewer positive charges on clay surfaces. Therefore, nitrate and nitrite both have
relatively high mobility, meaning they can move easily through the soil and do
not undergo much exchange. In addition, nitrate requires more energy by the crop after
it is taken up because the nitrate must be converted to ammonium in the plant before
it is made into proteins. Unfortunately, in well-aerated agricultural soils, ammonium
readily converts to nitrate in a process called nitrification,
which is described below.
Nitrification
Soil ammonium (NH4+) can quickly (hours to weeks) be converted into nitrite (NO2-) and then into nitrate (NO3-). This process, known as nitrification, only occurs in the presence of oxygen, so
generally it will be slow or non-existent in water logged, anaerobic soils. Notice
that the N in NH4+ loses H+, lowering pH, and gains oxygen (O) during nitrification. The microorganisms that
convert ammonium to nitrite and then to nitrate are called nitrifiers or nitrifying
bacteria. The second part of this process, the conversion of nitrite to nitrate, occurs
very rapidly in all but saturated soils. This is fortunate because nitrite is toxic
to both plants and animals.
Nitrification occurs most rapidly at pH levels between 6.5 and 8.5, at soil temperatures
between about 75 and 95o F, and at moisture contents above the wilting point. Nitrification
occurs rapidly in most agricultural soils, because they are generally well aerated,
near neutral pH, and have warm temperatures. Interestingly, anhydrous ammonia fertilizer
undergoes nitrification somewhat slower than other ammonia fertilizer materials because
the high pH and ammonia in the band (explained later) inhibit the nitrifying bacteria.
As pointed out above, it would be desirable if nitrification occurred more slowly,
because nitrate can be leached out of the soil profile, whereas ammonium generally
stays in the soil profile and is readily available for plant uptake and utilization.
Q&A #1
It sounds like it would be beneficial to stop or slow nitrification to prevent leaching
losses. Are there any products that do this?
There are two labeled compounds (nitrapyrin and dicyandiamide) designed to inhibit
nitrification as of the year 2000 in the U.S. (Hoeft et al., 2000). However, they
are not widely used in Montana or Wyoming, and research on the effectiveness of nitrification
inhibitors is mixed (Prasad and Power,
1997).
Dentrification
Denitrification refers to the process where nitrate (NO3-) becomes nitrogen gas (N2(g)). It is the opposite of nitrification in that oxygen is removed rather than
added. Denitrification requires the absence of oxygen, or ‘anaerobic’ conditions.
Poorly drained soils can result in a 4-5% nitrate loss per day, possibly causing
substantial yield losses (Hoeft et al., 2000). Similar to nitrification, microorganisms
are responsible for denitrification, and therefore it occurs faster in warm,
moist soils. Recall from the discussion on nitrification that nitrate can only form
in the presence of oxygen, whereas denitrification requires that nitrate be
present and there be no oxygen. Therefore, denitrification losses of N are most significant
when soils alternate between aerobic conditions, which allow nitrate to accumulate,
and anaerobic conditions. In fine textured soils, this could occur in a flood-irrigated
field. It can also occur in fields with shallow groundwater tables, especially during
irrigation cycles or oscillating dry and wet periods.
Interestingly, denitrification has been found to occur in soils containing 5% oxygen
(air contains about 20% oxygen). How is that possible if denitrifying
organisms require anaerobic conditions? The answer is that there are small pores within
the soil that can be saturated and anaerobic. These anaerobic ‘microsites’ have been
found to result in substantial levels of denitrification even in surface soils (Havlin
et al., 1999), although the amount of denitrification that occurs in Montana and Wyoming
soils is not known.
Denitrification is increased in soils that have readily decomposable organic matter
because denitrifying organisms rely on organic matter for energy. Plants
have been found to increase denitrification rates likely because of the release of
readily available organic matter from roots and root tissue. Denitrification increases
with temperature between 40 and 80o F, and is relatively constant above 80o F (Havlin
et al., 1999). It is inhibited at pH levels below 5.6, but is relatively constant
from pH 5.6 to 8, which encompasses the vast majority of Montana and Wyoming soil
pH levels. Using practices that prevent waterlogged soils is probably the best way
to ensure that denitrification losses are minimal.
Volatilization
Ammonia (NH3) volatilization refers to the loss of ammonia as a gas into the atmosphere, and can
be a source of N loss. The process is increased at high pH
because NH4+ will more easily convert to NH3 at high pH. Therefore, those fertilizers that increase pH further (urea and anhydrous
ammonia) may increase
ammonia volatilization. This is less of an issue in well-buffered soils, because the
fertilizer cannot increase the pH as substantially as in poorly buffered soils.
Buffering refers to the soil’s ability to resist change; for example, clay soils are
generally better buffered than sandy soils, and calcareous soils are generally highly
buffered. Because ammonia needs to be in contact with air to volatilize, incorporating
ammonia-based fertilizers into the soil will also substantially decrease volatilization
potential and increase yields. Volatilization increases with increasing wind, increasing
temperature (up to about 110oF), soil coarseness (likely due to better gas flow), and N fertilizer application
rates. Cool temperatures and generally well-buffered soils in Montana and Wyoming
may be two
reasons that researchers and producers in this region have not noticed substantial
losses of surface applied urea (Jackson, Jacobsen unpub. data).
Applying anhydrous ammonia in very dry or very wet soils can increase volatilization,
because the soil will not quickly seal behind the injector knife,
allowing the vapor to escape. Volatilization has been observed to occur the slowest
between 15 and 20% moisture in a loam soil (Prasad and Power, 1997). Applying ammonia-based
fertilizer immediately before a rainstorm can help push it further into the soil profile
where it is less available for volatilization. The best methods to decrease volatilization
are to incorporate fertilizers, apply during calm and cool periods, and if possible,
use split applications to decrease application rates (Table 3). Keep in mind from
the above that ammonium converts to nitrate (nitrification) in hours to weeks, and
once N becomes nitrate, it can no longer volatilize.
Table 3. Optimum conditions to minimize ammonia volatilization losses.
| Factor | Optimum |
| Temperature | Low |
| Wind | Calm |
| Moisture | 15-20% |
| Soil texture | Fine |
| Fertlizer replacement | Incorporated |
| N application rates | Low |
Mineralization
As microorganisms decompose organic matter, ammonium is released in a process called
mineralization. The amount of N converted from organic forms to available forms by
mineralization ranges from approximately 13 to 62 lb/acre per year (Pierzynski et
al., 2000). Mineralization amounts are higher in soils with higher amounts of organic
matter; therefore, taking steps to maintain or increase soil OM (with no-till, minimum
till, or organic additions) can help supply a
relatively constant amount of available N to the soil. As a rule of thumb, 20-30 lb
N/ac is mineralized per 1% OM. However, because mineralization requires microorganisms,
it is highly affected by soil conditions. For example, mineralization occurs optimally
in aerobic, moist, and warm soil, with near neutral pH levels.
The amount of mineralization is also dependent on the type of organic matter present.
Fresh manure or crop residue will break down faster than humus that is the result
of years of decomposition. In addition, the ratio between total soil carbon (C) and
total soil N affects how quickly this process occurs, because micro-organisms, like
plants, need N to live. For example, when the C:N ratio (i.e., total C divided by
total N) is less than about 30:1, net mineralization generally
occurs (Pierzynski et al., 2000). At C:N ratios less than 20:1, ammonia tends to accumulate,
which can volatilize and cause odor. For those who apply
organic materials, such as manure, sludge, or straw, it is especially important to
try to optimize mineralization to avoid depleting available N in the soil (if too
high a C:N is used) and to possibly avoid excessive odor, if this is a potential concern.
C:N ratios of various organic materials are shown in Table 4. Note
that the materials with low with low C:N ratios are generally more odorous, yet will
break down more quickly than those materials with high C:
N ratios. Different organic amendments can be mixed to obtain a desired C:N ratio.
Table 4. Carbon to nitrogen (C:N) ratios of various organic materials.
| Organic Material | C:N |
| Raw municipal wastewater | 5 |
| Treated municipal sludge | 10 |
| Soil organic matter | 10 |
| Sweet clover | 12 |
| Poultry manure | 16 |
| Steer manure | 20 |
| Rye | 36 |
| Corn roots | 48 |
| Corn/sorghum stover | 60 |
| Straw | 80 |
| Sawdust | 400 |
Q&A #2
It looks like crop residues have C:N ratios much higher than soil organic matter.
What makes the C:N of crop residues go down as they decay?
Microorganisms convert organic carbon to CO2 gas, which goes into the air, but N stays in the soil. Therefore, C levels decrease,
and N levels stay about the same, causing the ratio of C:N to decrease.
Immobilization
N immobilization refers to the process where inorganic N (NO3- or NH4+) is biologically converted to organic N, and is essentially the reverse of mineralization.
Microorganisms immobilize N by taking it up and converting it into proteins and cell
walls. By definition, plants also immobilize N, but immobilization more
commonly refers to the process where micro-organisms remove available N from solution.
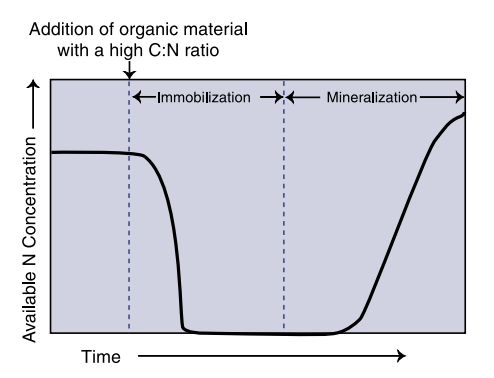
As you may expect, immobilization occurs more easily at high C:N ratios (above 30:1)
because microorganisms scavenge any available N in the soil as they help break down
the relatively N-free organic material (Figure 2). Plant growth can be substantially
stunted following the addition of a high C:N material unless N fertilizer is added
to offset the depletion of available N. It can take from four to eight weeks for available
N levels to begin to climb after addition of a high C:N crop residue or amendment
(Havlin et al., 1999), although
the time is dependent on all the factors listed previously that affect microbial health
such as soil water, available N, and temperature. Note that available N
concentrations can eventually be greater than initial N concentrations, even with
the addition of a high C:N organic material such as tilled-in grain stubble.
Because immobilization is controlled by microorganism growth, it occurs most readily
in warm, moist soils with near neutral pH levels. The best way to avoid
substantial amounts of N immobilization is to avoid large applications of high C:
N organic materials, or to supplement such additions with N fertilizers. Also
recall from Figure 2 that immobilized N will eventually become mineralized as microorganisms
die and decompose, increasing available N levels. Therefore,
immobilization is not necessarily a negative outcome, especially if it can be timed
with a period when a field is fallow, thereby capturing the N in a form that is
not leachable.
Figure 2. Available N changes following addition of high C:N organic material.
Nitrogen Fixation
Nitrogen gas (N2(g)) can be converted into available forms of N through the process known as ‘nitrogen
fixation.’ There are three major N fixation processes: ammonia fertilizer production,
lightning, and biological fixation. Ammonia fertilizers require natural gas, steam,
oxygen, and a catalyst to fix N2(g). Therefore, ammonia fertilizer prices are heavily dependent on the price of natural
gas. Lightning also fixes N, although the amount of available N that reaches the earth
from the atmosphere is generally less than 5 lb/acre per year (Brady, 1984).
Some organisms are able to convert atmospheric N2(g), which represents approximately 80% of the air we breathe, into ammonium. Worldwide,
biological N2 fixation is estimated at 145 to 200 million tons per year, compared to approximately
90 million tons per year of world fertilizer use (Havlin et al., 1999). In crop production
in the U.S., the amount of biological N2 fixation is approximately 1/3 of the amount
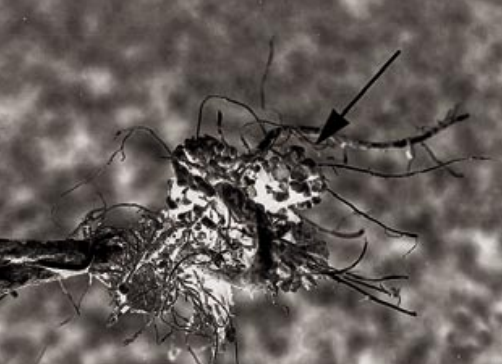
of fertilizer N applied (Havlin et al., 1999). ‘Symbiotic’ N2 fixation occurs when a bacterium, such as Rhizobium, ‘infects’ a root hair of a legume,
such as alfalfa. The root hair wraps around the bacterium, creating a nodule on the
root (Figure 3). The bacteria trapped inside the nodule continue to multiply and fix
N2 that is in the soil. Nodules are generally pink to salmon color when the organisms
are actively fixing N2(g) due to a compound called ‘leghemoglobin,’ which contains iron, and is similar to
hemoglobin in human blood.
Figure 3. Bacteria nodules on bean roots.
Symbiotic N2 fixation is affected by many factors, including nutrient content, inoculation, soil
pH, moisture, and plant health. Symbiotic N2 fixation is slowed by a lack of calcium, phosphorus, cobalt, boron, iron, copper,
or molybdenum. In addition, high levels of available N can greatly diminish N fixation
because the plant stops releasing a chemical that attracts the bacteria to the roots,
and the plant does not allow nodules to form. Specifically, in a mixed grass-legume
stand, N fertilization with up to 100 lb N/ac significantly decreased legume yield,
significantly increased grass yield, and had no effect on total yield above 33 lb
N/ac (Tueller, 1988). Essentially, high levels of N fertilization favor grass over
legumes, decreasing the amount of N that the legumes supply to the stand, and
converting the stand to primarily grass. Therefore, fertilizing pure legumes or legume-grass
stands with more than 30 to 40 lb N/ac is generally not recommended, although in some
grass-alfalfa stands, additional N can be a benefit for the second and third cuttings.
Keep in mind that phosphorus fertilizer requirements are generally met by the addition
of ammonia phosphate fertilizer materials, so some N is often supplied with P. For
more information on the effects of excess nitrate on legumes, see Nitrate Poisoning
of Legumes (MT9801AG-see Appendix for ordering information).
Each leguminous plant (called the ‘host’ plant) has a different strain of bacteria
that fixes N2. Therefore, that particular type of bacteria either needs to be in the soil, or added
with the seed, a step called ‘inoculation.’ For example, the bacteria species that
inoculates alfalfa will not work with beans, and vice versa. The positive effects
of inoculating legumes on plant health can be dramatic (Figure 4).
Figure 4. Effect of inoculation on nodulation and bean health. Plant on left was not inoculated, causing N deficiency.

N2 fixation is inhibited by pH levels below 6 for alfalfa and 5 for red clover. Legume
roots and N2 fixing bacteria can both be injured by high levels of
aluminum and manganese, which are elevated at low pH levels. Therefore, liming low
pH soils can help increase N2 fixation in legumes. N2 fixation is also increased when photosynthetic activity is increased, likely because
the N2 fixing organisms obtain more carbon when photosynthesis levels are high (Q&A #3).
Therefore, adequate moisture and warm temperatures will generally increase N2 fixation.
Q&A #3
What do bacteria get from the plant in exchange for providing N to the plant?
The bacteria receive carbon from the plant, which it needs for energy and growth.
The loss of carbon from the plant can be considerable and is why
the plant does not assist with fixation in a high available N environment. In addition,
the nodule provides a controlled, low oxygen, environment that allows the N2 fixation to occur.
Not only does N2 fixation supply N to the microorganism and plant, but it can also increase available
N levels in the soil for years following a legume crop. This is why rotating legumes
with grains can also increase available N levels in the soil for years following a
legume crop. This is why rotating legumes with grains can be an attractive cropping
strategy. For example, in a study of dryland wheatlegume rotations, wheat yield was
38 bu/ac for a wheat-field pea rotation compared to 32 bu/ac for continuous wheat
(Miller et al., 1998). In addition, wheat grown following peas had a protein level
of 13% compared to 12.1% for continuous wheat. Barley also shows increased yield following
a pea crop, with especially significant yield increases at low fertilizer N rates
(Figure 5). The difference in yields between barley grown in wheat versus canola stubble
is attributed to differences in pest pressure.
In addition to the symbiotic N2 fixation discussed above, there are also bacteria that fix N2 that are not attached to roots. Generally, these ‘free-living’ bacteria are not believed
to add more than about 5 lb N/ac to most agricultural soils (Havlin et al., 1999).
Figure 5. Yield of barley grown in pea, canola, and wheat stubble. Modified from Beckie
and Brandt (1997).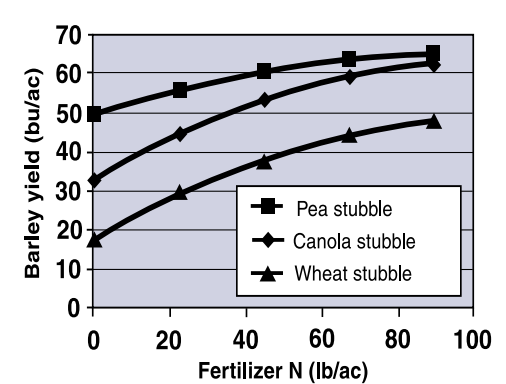
Leaching and Upward Movement
An available N ‘mass balance,’ or summary of inputs and outputs, should be starting
to form, meaning we’ve looked at N gains (release from exchange sites, mineralization,
and biological N2 fixation) and N losses (plant uptake, sorption to exchange sites, denitrification,
volatilization, and immobilization) to the available N pool. In addition, N fertilizer,
irrigation, manure, and precipitation (<5lb/ac-year), represent other inputs to the
pool (Table 5). The final potential loss from the soil system is nitrate leaching.
Table 5. Available N gains and losses in the soil.
| Gains | Losses |
| Release from exchange sites | Sorption to exchange sites |
| Mineralization | Immobilization |
| Biological fixation | Denitrification |
| Fertilizer | Volatilization |
| Precipitation | Plant uptake |
| Irrigation water | Leaching |
| Manure |
Nitrate is highly mobile as discussed previously and in Nutrient Management Module
2. The areas with the highest risk for nitrate leaching are associated with
high precipitation, irrigated conditions, or coarse textured, shallow soils. Nitrate
leaching, like denitrification and volatilization, represents an economic
loss, because once the N has left the soil system, it is not available for crop uptake.
In addition, because of health concerns with nitrate in groundwater, nitrate is regulated
by the U.S. Environmental Protection Agency (USEPA). In Montana, there are several
counties where average nitrate levels in groundwater approach the USEPA drinking water
standard of 10 ppm (mg/L) as N in drinking water, and the majority of counties located
east of the continental divide had at least one well exceeding this standard (Bauder
et al.,1993). Factors that were correlated with high groundwater nitrate concentrations
in Montana included coarse soil textures, low slopes, dryland crop production, tilled
cropland, and summer fallow. The lack of N and water uptake during summer fallow periods
likely increases nitrate leaching. Practices that increase crop uptake, and decrease
excessive percolation, should minimize the amount of nitrate leaching.
Nitrate can also move upward, especially in semiarid and arid regions. Upward movement
of nitrate and other soluble ions occurs when evaporation exceeds precipitation, causing
water to move upwards. The ease that nitrate moves either upward or downward affects
soil sampling methods for nitrate as described below.
Q&A #4
Why is nitrate in groundwater a concern?
Nitrate can cause a disease referred to as methemoglobinemia, or blue-baby disease.
Infants, as well as young livestock, have a different type of hemoglobin than adults.
If infants ingest water, food, or milk with excess nitrate and nitrite, oxygen is
pulled from their bloodstream, depriving them of
necessary oxygen.
Soil Sampling for Nitrate
Soil sampling methods and laboratory selection were described in detail in Nutrient
Management Module 1. This section briefly describes special
considerations for the sampling and testing of soil N. Generally, only soil nitrate,
and not ammonium, is sampled in soils because ammonium is converted so quickly to
nitrate via nitrification in agricultural soils that ammonium levels are generally
much lower than nitrate levels. Because nitrate is very mobile in soils, and can move
upward as pointed out above, sampling just the upper 6 inches is generally not a good
indicator of the total amount of nitrate available to the
plant-root system. Nitrate N should be sampled to 3 feet where possible, and up to
4 feet for deep rooted crops such as sugar beets and wheat, if a truck-mounted probe
is available. Generally, the top 6 inch sample and the 6- to 24-inch sample will be
analyzed for nitrate N. Samples greater than 24 inches can be composited and also
submitted.
The laboratory will generally calculate the total nitrate in lb/ac, although if the
data is reported in ppm, the conversion to lb/ac can be performed as shown
(Calculation Box 1). The factor of 2 in the equation is derived from the assumption
that an acre-furrow slice (6 inch slice) of soil weighs 2 million pounds. This number
is somewhat higher in soils with above average ‘bulk densities,’ which is the case
with compacted soils, and is somewhat lower with soils high in organic matter or that
have been recently plowed. The bulk density is simply the dry weight of the soil divided
by the volume, and is usually expressed in pounds per cubic foot (lb/ft3).
Calculation Box 1
CALCULATION: NITRATE-N (lb/acre) = NITRATE-N CONCENTRATION (ppm) X 2 X SAMPLE THICKNESS/6”
Example: 0-6 inch 8 ppm NO3-N (or nitrate-N, meaning nitrate expressed as N in ppm)
6- 24 inch 4 ppm NO3-N
N in 0-6 inch increment = 8 x 2 x 6”/6” = 16 lb/acre
N in 6-24 inch increment = 4 x 2 x 18”/6” = 24 lb/acre
N total in 0-24 inch profile = 40 lb/acre
Sampling deeper than 24 inches is not generally possible with a hand probe, but if
a truck-mounted probe is available, deeper samples can provide useful information.
For example, if a bulk of the soil nitrate is below 2 feet, and it’s believed that
much of this will be available to the crop, the fertilizer N recommendation can be
decreased. Soils can be broken into even more sections, especially when sampled deeper
than 2 feet. This provides the professional making fertilizer recommendations with
more information that will help to fine-tune the recommendation. For example, if the
bulk of the soil nitrate was near the bottom of the soil profile, the soil was coarse
and moist, and heavy precipitation had fallen since the time of sampling, it’s possible
that much of the deep nitrate leached out of the profile and should not be included
in the calculations of soil profile nitrate. Conversely, in a dry year, some nitrate
may not become available if roots cannot penetrate some dry sections of the soil.
In either case, N fertilizer recommendations may be increased somewhat. Growers should
sample following periods of drought to assess the soil nitrate levels since these
levels tend to accumulate during periods of below average yields. The
following section introduces the science, and art, of making accurate N fertilizer
recommendations.
N Fertilizer Recommendations
There are a number of strategies for determining N recommendations including historical
amounts, budget inventories of gains and losses, and using yield-response curves.
The strategies used by the different laboratories that serve Montana and Wyoming are
listed n MSU Extension Bulletin 150 (ordering information is in the appendix). Keep
in mind that fertilizer recommendations supplied by laboratories can vary based on
their philosophies and databases, and
should therefore be reviewed carefully (see NM Module 1). Budget inventories generally
assume an N mineralization amount (based on organic matter content
of the soil), previous crop contributions, residual (nitrate) N, and yield goal. Fertilizer
Guidelines for Montana Crops (EB 161) are based on applied research in
the Northern Great Plains, and require yield potential and soil NO3 -N to 2 feet (Table 6). The guidelines are currently being revised based on ongoing
research, and Table 6 reflects revised spring wheat guidelines. The yield potential
is generally based on past yields and can be adjusted based on soil moisture. Sometimes
the yield potential is assumed to equal an amount 5 to 10% higher than average historical
yields. The higher yields may be realistic if, for example, plans call for seeding
with higher yielding cultivars. The soil NO3-N, or ‘residual nitrate’ is either provided by the laboratory or calculated as was
shown in Calculation Box 1.
Table 6. Spring wheat N fertilizer guidelines for Montana
| Yield Potential bu/acre |
Soil NO3-N + Fertilizer N lb N/acre |
| 30 | 99 |
| 40 | 132 |
| 50 | 165 |
| 60 | 198 |
| 70 | 231 |
| 80 | 264 |
An example fertilizer N calculation is shown in Calculation Box 2 (previous page).
Note that the fertilizer guidelines recommend approximately 3.3 lb N/bu of
yield potential for spring wheat. This value is sometimes used instead of the tables.
Keep in mind that fertilizer guidelines are 1) guidelines that should be adjusted
based on your region and historical results and 2) often designed to optimize yield,
not quality. Recent research has shown that 3.2 lb N/bu is needed at yield potentials between
40 and 60 bu/ac to produce winter wheat with 14% protein, a protein level that pays
a premium (Jackson, 2001).
Calculation Box 2
CALCULATE THE N FERTILIZER REQUIREMENT FOR SPRING WHEAT THAT HAS A YIELD POTENTIAL
OF 50 bu/ac.
ASSUME SOIL N = 40 lb/ac AS SHOWN IN CALCULATION #1
Recommended Soil NO3-N + Fertilizer N = 165 lb/ac (from Table 6)
Fertilizer N = 165 lb/ac – Soil NO3-N
Fertilizer N = 165 lb/ac – 40 lb/ac
Fertilizer N = 125 lb/ac
Fertilizer needed = Fertilizer N/fraction of N in fertilizer
Urea needed = (125 lb/ac)/0.46 = 272 lb/ac
Once a fertilizer N requirement is determined, the amount of fertilizer to apply can
be calculated by knowing the fraction, or percentage, of N in the
fertilizer to be used (Table 7). For example, urea (CO(NH2) 2) has an analysis of 46-0-0, meaning it contains 46% N, 0% P2O5, and 0% K2O. Therefore, the fraction of N in urea is 0.46 (46/100), and the amount of urea needed
can be calculated as shown in Calculation Box 2. Additional information on the pros
and cons of various N fertilizers, application methods, and timing of fertilizer application
will be covered in a future module.
Summary
N can undergo numerous transformations in the soil that either make it more, or less,
available to plants. Some of these processes cannot be altered by producers, but are
instead controlled by soil factors such as soil texture and temperature. Some of these
processes, however, can be affected by different management practices, such as tillage,
irrigation, and residue management. By understanding the various factors that affect
the N cycle, N losses can be
minimized and yields optimized.
Soil samples for N should be collected as deep as possible due to nitrate’s high mobility,
and hence availability, in soils. N fertilization recommendations are
generally supplied by laboratories, but should be verified by using published fertilizer
guidelines and publications.
References
Bauder, J.W., K.N. Sinclair, and R.E. Lund. 1993. Physiographic and Land Use Characteristics
associated with nitrate nitrogen in Montana groundwater. J. Environ. Qual. 22:255-262.
Beckie, H.J., and S.A. Brandt. 1997. Nitrogen contribution of field pea in annual
cropping systems. 1. Nitrogen residual effect. Can. J. Plant Sci. 77:311-322.
Brady, N.C. 1984. The Nature and Properties of Soils. 9th Edition. Macmillan Publishing
Company New York. 750 p.
CFA. 1995. Western Fertilizer Handbook. 8th ed. California Fertilizer Association.
Interstate Publishers, Inc. Danville, Illinois. 338 p
Havlin, J.L., J.D. Beaton, S.L. Tisdale, and W.L. Nelson. 1999. Soil Fertility and
Fertilizers. 6th Edition. Prentice Hall. Upper Saddle River, NJ. 499 p
Hoeft R.G., E.D. Nafziger, R.R. Johnson, and S.R. Aldrich. 2000. Modern Corn and Soybean
Production. MCSP Publications. Champaign, IL.
Jackson, G.D. 2001. Fertilizing winter wheat with nitrogen for yield and protein.
Fertilizer Fact Sheet 26. MSU Extension Service and Agricultural Experiment Station,
Bozeman, MT.
Production and Marketing. Proc. Wheat Protein Symposium, Saskatoon, Saskatchewan.
9-10 March, 1998. University Extension Press, Saskatoon, Saskatchewan, Canada.
Pierzynski, G.M., J.T. Sims, and G.F. Vance. 2000. Soils and Environmental Quality.
2nd Ed. CRC Press. Boca Raton, FL. 459 p.
Prasad, R. and J.E. Power. 1997. Soil Fertility Management for SustainableAgriculture.
CRC Press, Boca Raton, FL. 356 p.
Tueller, P.T. 1988. Vegetation Science Applications for Rangeland Analysis and Management.
Kluwer Academic Publishers. Norwell, MA.
Appendix
Books
- Western Fertilizer Handbook. 9th Edition. 2001. Soil Improvement Committee. California Fertilizer Association. Interstate Publishers. 351 p. (http://agbook.com/westernfertilizerhb.asp) $35 including shipping.
- Plant Nutrition Manual. J. Benton Jones,Jr. 1998. CRC Press, Boca Raton, Florida. 149 p. Approximately $50.
- Soil Fertility. Foth and Ellis. 1997. CRC Press, Boca Raton, Florida. 290 p.
- Soil Fertility and Fertilizers: An Introduction to Nutrient Management. Havlin, J.L., S.L. Tisdale, J..C. Beaton and W.L. Nelson. 7th edition, 2005. Pearson Prentice Hall. Upper Saddle River, New Jersey. 515 p. approx. $100.
Extension Materials
- Fertilizer Guidelines for Montana Crops (EB161), single copy is free. Online at: https://www.montana.edu/extension/Full_HTML_Pubs/eb161-fertilizerguidelines/EB0161-FertilizerGuidelinesForMontanaCrops.html
- Soil, Plant and Water Analytical Laboratories for Montana Agriculture (EB 150), single copy is free.
Obtain the above Extension materials:
MSU Extension Publications
P.O. Box 172040
Bozeman, MT 59717-2040
Personnel
Engel, Rick. Associate Professor. Montana State University, Bozeman. (406) 994-5295. gel@montana.edu”engel@montana.edu
Jackson, Grant. Associate Professor. Western Triangle Agricultural Research Center, Conrad. (406) 278-7707. gjackson@montana.edu
Jones, Clain. Extension Soil Fertility Specialist. Montana State University, Bozeman. (406) 994-6076. clainj@montana.edu
Westcott, Mal. Western Agricultural Research Center, Corvalis. Phone: (406) 961-3025. westcott@montana.edu
Web Resources
https://extension-store.montana.edu/ Montana State University Publications ordering information on Extension materials.
http://agnotes.org MSU weekly Agronomy Notes by Dr. Jim Bauder on a range of issues, including fertilizer management. Currently there are 23 notes on Fertilizer Management, and over 300 Agronomy notes total answering questions from producers, Extension agents, and consultants.
https://landresources.montana.edu/fertilizerfacts Fertilizer Facts summarizing fertilizer findings and recommendations based on field
research conducted in
Montana by Montana State University personnel.
We encourage the use of this document for nonprofit educational purposes. This document
may be reprinted for nonprofit educational purposes if no endorsement of a commercial
product, service or company is stated or implied, and if appropriate credit is given
to the author and MSU Extension. To use these documents in electronic formats, permission
must be sought from the Extension Communications Coordinator, 135 Culbertson Hall,
Montana State University, Bozeman MT 59717; E-mail: publications@montana.edu
The U.S. Department of Agriculture (USDA), Montana State University and Montana State
University Extension prohibit discrimination in all of their programs and activities
on the basis of race, color, national origin, gender, religion, age, disability, political
beliefs, sexual orientation, and marital and family status. Issued
in furtherance of cooperative extension work in agriculture and home economics, acts
of May 8 and June 30, 1914, in cooperation with the U.S. Department of Agriculture,
Cody Stone, Director of Extension, Montana State University, Bozeman, MT 59717.