|
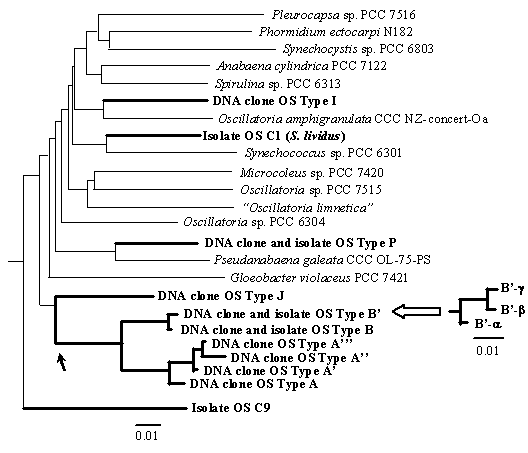
Figure 3. Cyanobacterial 16s rRNA phylogeny. Mat sequences are bold-highlighted.
Inset shows ITS variation within 16s rRNA genotype B'.
|
|
Fig. 3 shows a tree of diversity in cyanobacterial 16S rRNA sequences, with thin lines providing
a background of diversity within this kingdom. The thick lines indicate the diverse
cyanobacterial 16S rRNA sequences we detected in a hot spring microbial mat. Clearly,
the mat contains more cyanobacterial diversity than meets the eye. Again, line lengths
separating sequences (in this case horizontal component only) equate to genetic differences.
The readily cultivated sequence (Isolate OS C1, S. lividus) is unrelated to the predominant ones, which comprise a set of closely related sequences
we call A/B types. The difference between type C1 and the A/B types is very large,
certainly representing different species, but more likely representing differences
on the same scale as the difference between flowering plants and ferns! But, what
about the closely related sequences of the A/B group? By studying the distribution
of these genetic variants along ecological gradients, we learned that even the most
closely related sequences appear to correspond to ecologically distinct cyanobacterial
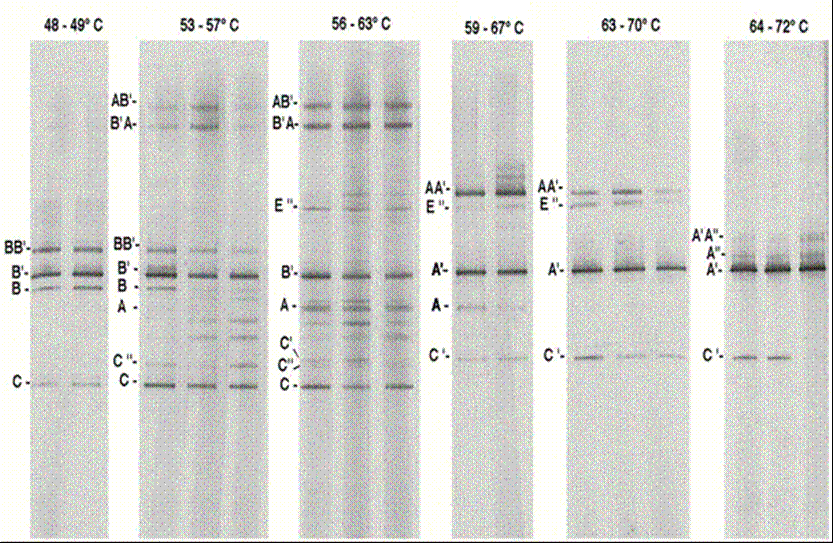
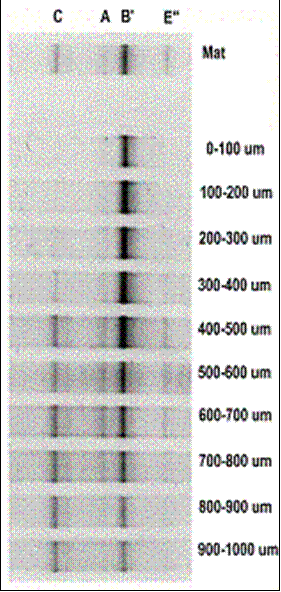
populations. Fig. 4 (below) shows different A/B genotypes at different temperatures and depths. Note
the progression of genotypes from B to B’ to A to B’ to A’’ from low to high temperature
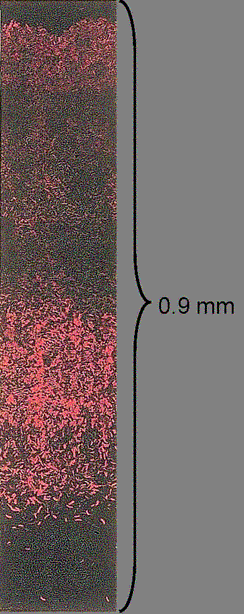
and the subsurface position of genotype A corresponding to pigment-rich Synechococcus 400-700 µm below the mat surface. We are currently examining pure cultures of A/B
lineage Synechococcus to evaluate whether, as predicted from distribution studies, these are temperature-
and light-adapted ecological populations. Together with evidence from other laboratories,
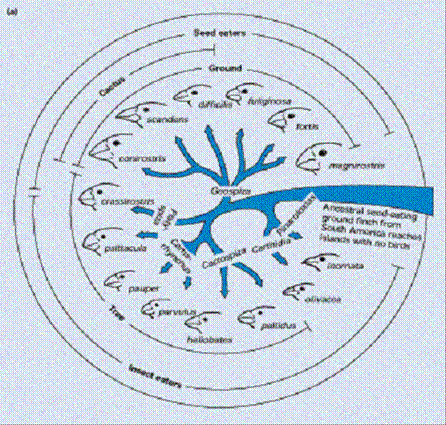
it seems clear that, like plants and animals (e.g., Fig. 5, left), prokaryote diversity is acted upon by natural selection to yield ecologically
specialized populations. We term these populations ecotypes, but they can be taken as species if an ecological concept of species is applied.
[Ward, 1998; Ward et al., 1998, 2002] |
|