


Module 1: Soil Sampling and Laboratory Selection
December 2024
4449-1
By Clain Jones, Extension Soil Fertility Specialist and Professor; Jeff Jacobsen,
former Professor of Soil Science, Kathrin Olson-Rutz,Research Associate
Department of Land Resources and Environmental Sciences
Introduction
This module is the first in a series of Extension materials designed to provide pertinent information on a variety of nutrient management, water management, and water quality. A resource section of other Extension materials, books, and web sites is also included.
Objectives
Soil testing and laboratory selection are critical components of all nutrient management
operations. With fertilizer representing a major cost input, it is very important
to apply the correct amount of fertilizer and/or soil amendments to optimize economic
return. The objectives of this module are to:
1) describe soil sampling and handling procedures,
2) explain the different philosophies in soil testing programs, and
3) provide criteria for selecting analytical laboratories that will provide accurate
results.
Background
Soil sampling and testing provide an inventory of nutrients in the soil, as well as
other soil characteristics that influence soil fertility, such as pH, soil organic
matter (SOM) and cation exchange capacity (CEC). Soil testing for plant available
nitrogen (N), phosphorus (P), and potassium (K) is done to help determine crop nutrient
needs and monitor previous management practices. The other macronutrients (calcium
and magnesium) and micronutrients (boron, chlorine, copper, iron, manganese, molybdenum,
nickel and zinc) are sometimes analyzed to diagnose nutrient deficiencies. In addition,
soil testing is required for concentrated animal feeding operations (CAFO) prior to
animal manure application on CAFO fields.
Soil analysis of plant available nutrients is a difficult and sometimes inconsistent
process, partly because different analytical procedures may be used to estimate the
same plant available nutrient. For example, the “Olsen P” test is generally used in
Montana and Wyoming, but labs in the Midwest often use the “Bray” test, largely due
to lower soil pH levels in the Midwest. Therefore, the laboratory selected should
be familiar with the recommended tests from the states
where the soil was collected to use the appropriate analytical procedure. Fertilizer
recommendations are subsequently provided by the laboratory or calculated by the end
user of the soil test data (see Developing Fertilizer Recommendations for Agriculture; resources mentioned in this bulletin are listed in the appendix). Fertilizer recommendations
may vary greatly between laboratories for the same soil, in part due to different
fertilization philosophies.
Soil Testing
A goal of soil sampling is to characterize the nutrient status of a field as accurately and inexpensively as possible. Details on sampling plans, locations, depths, tools, timing, and sample handling follow.
Sampling Plan
A sampling plan determines where and when to collect soil samples that are representative
of the field to be fertilized. If soil is submitted from only a few locations that
do not represent the entire area to be fertilized, the fertilizer added may be too
much or too little for the majority of the acreage, causing decreased yields, reduced
crop quality, or wasted fertilizer.
Sampling depth and timing of sampling are also critical components of a well-designed
sampling plan and should be consistent over years. The sampling plan can be constructed
in the sampler’s head, but it may be more objective to sketch out the plan ahead of
time. The actual locations sampled should
be recorded, to provide location-specific fertilization recommendations and to sample
same locations in following years.
Sampling Locations
To minimize laboratory costs, soil samples are generally collected from several locations
within a field, composited (mixed) in a clean container, subsampled from within that
container, and submitted in a bag to an analytical laboratory. The standard sampling
method is to collect soils systematically at
fixed intervals as shown in Figure 1a. Distance between sampling locations can be
greater on homogenous fields than on variable fields.
If more information is desired about the variability within a field, then separate
soil samples should be collected from areas that have had different crop history,
yield, and fertilizer treatments, or that vary substantially in slope, texture, depth,
or soil color (Figure1b). Either develop specific recommendations
for each of the area types, or calculate a field average giving weight to different
area samples in proportion to the amount of field area they represent. Furrows, headlands,
channels, potholes and straight lines along potential fertilizer bands should be avoided.
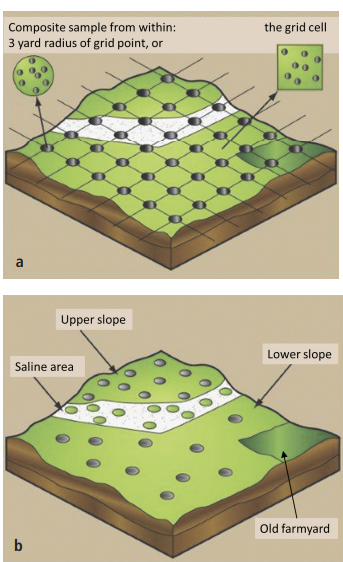
FIGURE 1. Soil sampling schemes in a grid pattern (a) or by zone (b). Adapted from reference 1 and used by permission.
To identify sampling zones, start with maps. Soil characteristics are influenced by
topography and soil type. Topography maps are used to divide a field into upland,
sloping and depression positions which correlate with soil nitrate-N, P, K, zinc,
copper, chloride and pH (2,3,4). Maps can be created from actual ground surveys, Light Detection And Ranging (LIDAR),
or real-time kinetics-global positioning satellite signals (RTK-GPS).
Published soil surveys are of limited value because they are mostly available in an
average size delineation of 3 acres (NRCS “Order 2”). This is not detailed enough
for site-specific variable rate fertilization (discussed later in this section). Order
1 surveys, with a minimum 1-acre size delineation, are not readily available, are
costly, and are not as consistently related to soil nitrate as topography based zones
and are no better than 1-acre grid sampling for
soil nitrate (5).
Satellite images with 30 meter resolution (¼ acre) are effective in delineating zones.
The images are made up of distinct wavelengths which are converted to an index, such
as normalized difference vegetation index (NDVI), to represent varying levels of a
parameter such as plant nutrient content, water content, soil
characteristics (such as color) and yield. If possible, use an image taken in an “average”
year at a time between when the canopy closes to just before flowering (see “Web resources”
at the end for links to electronic map resources). Because the relationship between
indices and any of the above parameters are only estimates based on other research,
calculated values should be ground-truthed and verified. Aerial photos can be used
but may be hard to get and may be too detailed. Hand-held active optical sensors (e.g.,
chlorophyll meters) are a good compromise between satellite and aerial photograph
resolution and can be attached to equipment used during normal field operations.
Soil electrical conductivity (EC) or soil electromagnetic (EM) sensors have been successfully
used to develop nutrient and crop management zones. Both are good at detecting patterns
across a field but do not relate to a given soil characteristic. Soil EC has been
most useful in coarser-textured soils and fields with salinity problems (4).
Q&A1
How do I decide the number of soil samples to collect?
This is dependent on the size of the field, the variability within the field, the
fertilizer application equipment, how feasible it is to change application rates
within a field, and how much time and money is allocated for sampling. For example,
if a producer has 100 acres on a uniform-looking field, all within the
same soil series, one composite sample from 20 soil samples is recommended to characterize
that field. However, if the field has different depths of a horizon, has visual differences
in color or other characteristics, then 20 soil samples may not be adequate. In addition,
if the producer has equipment capable of variable rate application, then more samples
will allow for more precise application of fertilizer. In a practical sense, the number
of cores collected will be largely dependent on the time required to sample and the
available sampling budget.
Patterns of crop yield are useful to delineate nutrient management zones. Yield maps
from a field over several years will indicate zones that are consistently low- or
high-producing and can help direct soil sampling. Also, if soil test results indicate
adequate or high nutrient evels in low-yielding areas, then the soil
should be examined for compaction and other physical characteristics that could affect
yield, particularly those that affect water storage or drainage. Fertilizer can likely
be reduced in these areas. See Yield Mapping and Use of Yield Map Data for detailed information on yield mapping.
Combining several of these mapping tools to delineate sampling zones is effective
in improving soil nutrient management, and increasing yields and quality (6). If a specific factor (such as N) is not a consistent predictor of yield, and yield
maps are the primary tool for delineating zones, this may bias the sampling process.
The technology used and the resolution obtained in electronic mapping is constantly
improving, but most don’t cluster the data into convenient “upland, slope, and depression
points.” Compare the map with what you see on the ground.
To determine the worth of sampling by zones, an economic study of continuous corn
compared 100-yard sampling grids to sampling by soil series on a 160-acre field (7). Grid sampling produced overall higher yields, but the soil series sampling resulted
in greater profits, primarily due to lower analytical costs (6-fold fewer samples)
and lower fertilizer costs. General recommendations on when to use grid versus topography
sampling are presented in Box 1. For practical reasons, fields are generally broken
up into three to five management zones in Montana. Zone based sampling may take more
planning time, but it might lead to fewer samples to analyze.
Box 1: Conditions for using grid vs zone sampling
Grid sampling:
- For non-mobile nutrients (e.g., P, K, zinc), especially if previously applied at high levels1
- History of manure application1
- High levels of fertilizer previously applied1
- Small fields merged to form larger fields1
Zone sampling:
- For mobile nutrients, especially N1
- For soil organic matter and pH2
- Unknown field history3 or long cropping history4
- No history of manure application1
- History of high within field variability (factor of 2 to 3)
- History of less than maintenance levels of fertilizer application1
- Remote sensing or yield monitor information indicates relationship of yield to landscape1
Reference 8; 2 - Reference 9; 3 - Reference 10; 4 - Reference 11
Sampling Number
Table 1 lists the range and average of nutrient concentrations found in a field, and
shows why taking a few samples could greatly misrepresent the nutrient status of a
field. Generally 12 to 20 sub-samples composited into one sample provide a reasonable
representation of a relatively uniform 80-acre field (12, 13). As field size increases, slightly increase the number of sub-samples or submit samples
from different zones. Nitrate-N and P are more variable and require more subsamples
for an accurate value than K (Table 2). Fields fertilized with manure, with low nutrient
levels, or under conventional tillage require fewer samples. No-till fields and those
with fertilizer applied in bands require more sub-samples due to unique distribution
patterns of P, K, and pH (13). Soil cores from band rows can contain twice the level of P as cores from between
band rows in reduced and no-till fields (14). Banded K also leaves unequal distribution of K, but to a lesser extent than P. If
feasible, increase the number of random cores to reduce any bias. With an immobile
nutrient like P, look for long-term changes in soil nutrient levels especially in
reduced and notill systems to avoid fertilizing based on “outliers.”
Sampling for site-specific variable rate fertilization, also called “zone management”
or “precision agriculture,” generally involves sampling using grids (15). Site-specific yield and grain protein have been combined with soil measurements
such as EC, topography, and upslope area to generate models to guide N fertilization
and increase net revenue (16). For more information see Site-specific Management Guidelines and What is Site-specific Farming?
TABLE 1. Range and average of test values from 40 individual soil cores from an 80-acre field1
|
Analysis
|
Range (lb/acre)
|
Average (lb/acre)
|
|
Nitrate-N
|
12-225
|
53
|
|
P2O5
|
5-250
|
39
|
|
K2O
|
156-1164
|
557
|
|
Confidence Level |
Accuracy Level
|
|||||
|
±15%
|
±25%
|
|||||
|
Nitrate-N
|
P2O5
|
K2O
|
Nitrate-N
|
P2O5
|
K2O
|
|
|
Percent
|
Number of sub-samples
|
|||||
|
90
|
25
|
34
|
7
|
10
|
12
|
3
|
|
80
|
18
|
21
|
5
|
6
|
8
|
2
|
|
70
|
10
|
14
|
3
|
4
|
5
|
2
|
|
Nutrient range (lb/acre)
|
||||||
|
80
|
45-61
|
32-45
|
463-626
|
40-66
|
30-68
|
408-680
|
that this field has 45-61 lb nitrate-N/acre.
Sampling Time
Soil sampling should be timed to allow adequate lead time for sample analysis, data
interpretation, fertilizer recommendation, and application, though should be performed
as close to seeding as practical. Due to time restrictions or soil conditions, it
may be more practical to sample in the late fall or winter for
spring-planted crops. Fall sampling results are likely quite similar to spring sampling
results if the fall is dry and the winter is cold, restricting microbial activity.
Yet, a 3-year Montana study found that nitrate increased about 20 lb N/acre from late
August to early April (17), causing over-fertilization of N on average
(since rates in Fertilizer Guidelines for Montana Crops are based on spring sampling results). Coarse or shallow soils (less than 2 feet)
have a better chance of overwinter nitrate loss than fine-textured or deep soils,
resulting in possible under-fertilization if fertilization rates are based on fall
samples (17). Organic matter, pH, and soluble salts are likely to be similar between fall and
spring, regardless of weather conditions.
Potassium varies relatively little within a field, but varies greatly over time. It
is rapidly released from plant residue and can move quickly among its forms in the
soil (18). Therefore, soil test K is influenced by time between harvest and soil sample collection
and the weather during that time, which impacts K release from residue. Spring or
late fall sampling is likely best. Notes about sampling timing and prior weather can
help interpret K soil test values that may seem unusual.
Sampling Depth
The sampling depth should correspond with crop rooting depth. For example, if the
bulk of a plant’s roots are located within the top 6 inches of soil, then the relatively
immobile nutrients (such as P and K) need only be sampled in the top 6 inches. Sampling
depth for the more mobile nutrients (nitrate, sulfate, and chloride) should be to
the depth that roots can extract water.
This depth varies with crop, cropping system, and soil depth. For example, winter
wheat grown in an alternate crop-fallow cropping system will use water, and therefore
access N to approximately 6 feet though sampling that deep is generally unfeasible.
However, in a continuous cropping system, winter wheat
may only access N to 2 or 3 feet because of the lack of soil water at deeper depths.
Therefore, the sample depth for the mobile nutrients is a compromise of usually 2
to 3 feet.
Sampling and Handling Methods
Crop residue should be removed from sampling locations. Special areas, such as salty
areas, eroded knolls, wet spots, and those without plant growth, should be sampled
separately or avoided. Samples should be collected to the maximum depth needed and
then divided into depth increments such as 0 to 6 and 6
to 24 inches (Figure 2). Each depth increment should be mixed thoroughly in a large
plastic container, subsampled, and placed into a plastic-lined soil sampling bag or
glass jar. Laboratories will either supply sampling bags or can direct you to suppliers.
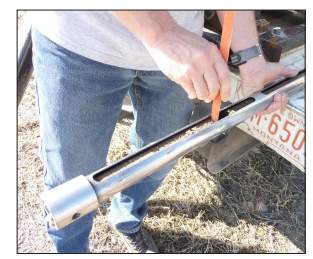
Figure 2: Sub-sampling depth intervals
Samples should either be kept cool below 40°F, dried at 110 - 120°F, or frozen and
dried later to prevent nutrient transformations caused by microorganisms.
Soil nitrate levels have been found to increase by 60 to 300% over three days when
kept at room temperature and surprisingly by 30 to 200% over three days
when refrigerated at 39°F (19). Increases can even occur during drying, likely in the center of larger soil clods
which take a while to dry, allowing an extended period of microbial activity; therefore,
break up soil clods before drying. Avoid wetting-drying and freezing-thawing cycles.
Oven drying above 120°F is not
recommended because the excess heat can change the availability of nutrients, making
some tests invalid. For example, P can precipitate into relatively
unavailable minerals. If drying or cooling equipment is unavailable, samples should
be shipped overnight to a laboratory. During any preservation technique, care should
be taken to avoid contamination from dust or foreign particles. Sampling equipment
(Figure 3) should be cleaned between fields and stored
away from fertilizers to prevent contamination.
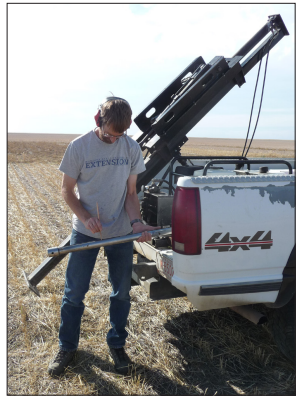
Figure 3: Truck-mounted Probe
Choosing a Lab
Selecting a laboratory that can supply fast and accurate results can be time-consuming;
however, the time spent in choosing a good laboratory can quickly pay for itself in
the form of accurate fertilizer recommendations, desired crop responses, and better
economic returns. A high degree of variability has been observed in fertilizer recommendations
among laboratories. Specifically, some studies have shown that when the same soils
were sent to different laboratories requesting a fertilizer recommendation for a specific
crop and yield goal, significantly different recommendations have been provided (20, 21, 22). Fertilizer
recommendations can differ because of differences in test results and/or the approach
used to develop a recommendation.
In general, laboratories’ methods are consistent and provide reliable results for
nitrate-N (NO3-N), and K, whereas test results for soil organic matter are least reliable and test
results for P are intermediate (23). However, researchers have found substantial differences in soil analytical results
that may affect fertilizer recommendations. In a study of 10 laboratories used by
northern Great Plains consultants and producers, nitrate-N concentrations reported
for the same soil
ranged from 3 to 95 pounds N per acre (22). This difference would alter fertilizer recommendations substantially. Phosphorus
test results varied from 7 to 42 ppm, and averaged 28 ppm, in one of the four soils
tested in this study. Phosphorus fertilizer would likely be recommended for a soil
with a 7 ppm test result, yet would likely be wasted on this soil if the actual value
was similar to the average soil test P value of 28 ppm (well above the critical level).
Selecting a laboratory belonging to a proficiency testing program (discussed below)
should greatly improve accuracy.
Some of the differences in results may be due to different analytical methods. For
example, laboratories either use Bray, Olsen or Mehlich P tests, all of which use
different extractants. In Montana’s alkaline soils, P is typically tested using Olsen
P, also known as bicarbonate-P. Olsen P is fairly robust and works below pH 7, while
Bray does not generally work well above pH 7. Bray and Mehlich test results do not
convert readily to Olsen P. Because P fertilizer guidelines for Montana crops are
based on Olsen P, ask the soil testing lab to only use this test. Unfortunately, some
laboratories do not report which test they use. Therefore it is critical that the
user of soil analytical results be aware of the actual analytical procedure since
different tests may produce different results.
Fertilizer recommendations are based on a sufficiency, build, or maintenance approach
(Figure 4). The sufficiency approach only suggests fertilization when there are insufficient
amounts of nutrients in the soil for the present crop. With the sufficiency approach,
“critical” values are used to determine whether a field
should be fertilized. The critical value is the nutrient test result above which only
minimal yield responses are observed when fertilizer is added. A maintenance approach
replaces nutrients removed by crop harvest without substantially changing the soil
test level, whereas a build approach increases the soil test level over time. The
build approach is generally only practiced at low soil test levels, and maintenance
is generally only done at higher soil test levels. Table 3 demonstrates example P
fertilizer recommendations for a sufficiency, maintenance, and build approach at two
P soil test levels.
Table 3. Example difference in banded P fertilizer recommendations using different approaches
| Winter wheat grain yield potential = 60 bu/acre Expected straw removal = 1.5 ton/acre Critical test level for P is approximately 16-18 ppm for all crops |
||
| Olsen P Soil Test 4ppm |
Olsen P soil test 20ppm |
|
| Sufficiency approach1 | 50 | 0 |
| Maintenance approach2 = crop removal |
43 | 43 |
| Build approach = sufficiency + maintenance |
93 | 43 |
1 - Table 18 in Fertilizer Guidelines for Montana Crops; 2 - Table 21 in Fertilizer Guidelines for Montana Crops
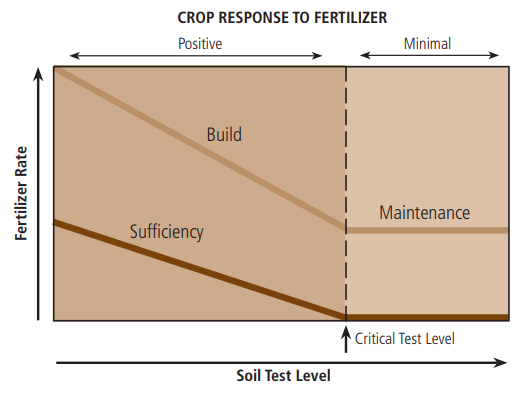
Figure 4: Fertilizer recommendation philosophies and crop yield response.
The resulting economic differences between different philosophies and different laboratories
can be large. For example, in a multi-year study of fertilizer recommendations from
six different laboratories, fertilizer recommendations from one lab were double those
of another lab, yet there were no significant differences in yields (24). In another study, the greatest economic return was four times higher than the least
economic return based on six different labs’
fertilizer recommendations (20), demonstrating the importance of accurate fertilizer recommendations.
Growers can assist laboratories in making accurate recommendations by selecting realistic
yield goals. These must reflect the soil type and area climate.
A recommendation that is satisfactory on calcareous soil in a semiarid area may be
very different than one for a soil containing the same nutrient level but from an
area with different soil type and climate.
Q&A2
How do I choose a good soil analytical laboratory?
A list of laboratories in the Northern Great Plains is included in the appendix. Methods
used by these labs are described in Interpretation of Soil Test Reports for Agriculture.
Start by choosing two or three based on your experience and others’ recommendations.
Then, ask questions: 1) Do they participate in the North American Proficiency Testing
Program (NAPT) or the Agricultural Laboratory Proficiency Program (ALP)? 2) What other
QA/QC protocols (quality assurance/quality control) do they use? 3) Will they send
results from both their NAPT or ALP and relevant QA/ QC results? 4) What kind of technical
support do they provide? If they don’t know the answers to the above questions, or
aren’t willing to send on results, that may be a red flag. If you can obtain results
from more than one laboratory, compare the results between laboratories to see which
look more accurate (see “Assessing Laboratory Accuracy”).
Accessing Labortory Accuracy
Any quality assurance/ quality control (QA/QC) data supplied by a laboratory should
have both a “true” value and a measured value for each analysis (pH, nitrate-N, P,
etc.) for a certified soil, sometimes referred to as an “external standard.” The true
values reported are typically the average results from many reputable laboratories
for that standard, producing a “mean” value. The Agriculture Laboratory Proficiency
Program reports the mean, while the North
American Proficiency Testing Program reports the “median” value, which is the concentration
that has the same number of labs reporting higher values as
lower values, and is often close to the mean. By subtracting the difference between
the true and the laboratory measured concentration and dividing this difference by
the true value, you can obtain a relative estimate of “error” (accuracy), that is,
how close the laboratory’s test comes to the true value (Figure 5). You can compare
the errors reported by laboratories that you are considering using, and choose a laboratory
that has a low error (high accuracy) for the test(s) that you are most interested
in (e.g., nitrate-N, P).
Laboratories should also have high “precision,” which is a measure of how consistent
the results are for the same sample (Figure 5). Some laboratories may report the “standard
deviation,” which is a measure of how precise the results are (low standard deviation
implies high precision). 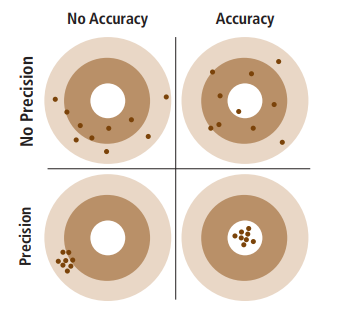
Figure 5: Accuracy represents how close the samples are to the true value, while precision
describes how close the samples are to each other.
Summary
Accurate and economical fertilizer recommendations are only as good as the sampling
and analytical techniques used to determine these recommendations. A welldesigned
and implemented soil sampling plan will consider topography, soil type, and sampling
timing, depth, and preparation/ storage. The economic worth of each sampling strategy
will be dependent on the crop(s) grown, analytical costs, and fertilizer costs. Testing
and developing recommendations for
specific soils or areas rather than whole fields can produce greater returns if appropriate
crop yield goals, accurate soil tests, and reliable fertilizer recommendations are
used (25). The experience and knowledge of the land owner or producer should be utilized extensively
to select a method of soil sampling. Laboratories range greatly in their accuracy
and precision; therefore, laboratories should be selected by comparing their quality
assurance/quality
control data. Other nutrient management modules address nutrient cycling, testing,
and fertilizer recommendations for specific nutrients, such as N, P, and K.
References
- IPNI, International Plant Nutrition Institute. 2012. 4R Plant Nutrition: A Manual for Improving the Management of Plant Nutrition. International Plant Nutrition Institute, Norcross, Georgia, USA. 66p.
- Franzen, D.W., A.D. Halvorson, and V.L. Hofman. 2000. Spatial nutrient relationships and profitability of variable-rate fertilizer application
in a wheat and sunflower rotation. p. 88-93. In: Great Plains Soil Fertility Conference Proceedings. p. 88-93. March
4-8. Denver, Colorado. A. Schlegel [Ed.].
Potash & Phosphate Institute, Brookings, South Dakota. - Franzen, D.W., T. Nanna, and W.A. Norvell. 2006. A survey of soil attributes in North Dakota by landscape position. Agronomy Journal. 98:1015-1022.
- Franzen, D., 2013. Developing Zone Soil Sampling Maps. North Dakota State University Extension Publication SF-1176-2. 4p.
- Franzen, D.W., D.H. Hopkins, M.D. Sweeney, M.K. Ullmer, and A.D. Halvorson. 2002. Evaluation of soil survey scale for zone development for site-specific nitrogen management. Agronomy Journal. 93:381-389.
- Franzen, D., T. Nanna, F. Casey, D. Ralston, J. Staricka, M. Halvorson, V. Hofman, J. Lamb, and A. Sims. 2005. Zone delineation for nitrogen management. 21:25-32. November16-17. Des Moines, Iowa. Potash & Phosphate Institute, Brookings, South Dakota.
- Clay, D.E., J. Chang, C.G. Carlson, D. Malo, S.A. Clay, and M. Ellsbury. 2000. Precision farming protocols. Part 2. Comparison of sampling approaches for precision phosphorus management. Communications in Soil Science and Plant Analysis. 31:2969-2985.
- Franzen, D.W., L.J. Cihacek, V.L. Hofman, and L.J. Swenson. 1998. Topography-based sampling compared with grid sampling in the Northern Great Plains. Journal of Production Agriculture. 11:364-370.
- Mallarino, A.P. and D.J. Wittry. 2004. Efficacy of grid and zone soil sampling approaches for site-specific assessment of phosphorus, potassium, pH, and organic matter. Precision Agriculture. 5:131-144.
- Franzen, D. Personal communication. Extension Soil Specialist, Department of Soil Science, North Dakota State University. Fargo, North Dakota.
- Mallarino, A.P., D.B. Beegle, and B.C. Joern. 2006. Soil Sampling Methods for Phosphorus – Spatial Concerns. A SERA-17 Position Paper.
- Swenson, L.J., W.C. Dahnke, and D.D. Patterson. 1984. Sampling for Soil Testing. North Dakota State University, Department of Soil Sciences, Research
Report No. 8. - Miller, R. 2011. Grid point soil sampling phosphorus and potassium uncertainty. NCERA 13 Workshop Proceedings. p. 60-61. February 22-23. Bettendorf,
Iowa. - Mallarino, A.P., and R. Borges. 2006. Phosphorus and potassium distribution in soil following long-term deepband fertilization in different tillage systems. Soil Science Society of America Journal. 70:702-707.
- Franzen, D.W. and T.R. Peck. 1995. Field soil sampling density for variable rate fertilization. Journal of Production Agriculture. 8:568-574.
- Barroso, J., P. Lawrence, C. Merja, and B. Maxwell. 2014. Spatial Optimization of Nitrogen Application for Wheat. Fertilizer Facts No. 65. Montana State University. 2p.
- Jones, C., C. Chen, J. Eckhoff, M. Greenwood, P. Lamb, A. Lenssen, K. McVay, P. Miller, B. Stougaard, J. Weeding, and M. Westcott. 2011. Changes in soil nitrate-N levels from late summer to early spring in Montana. Fertilizer Facts No. 55. Montana State University. 2p.
- Mallarino, A.P., P.A. Barbagelata, M.W. Clover, C.X. Villavicencio, and L.B. Thompson. 2011. Factors determining high temporal soil-test potassium variation and soil sampling and testing alternatives. NCERA 13 Workshop Proceedings. p. 3-11. February 22-23. Bettendorf, Iowa.
- Westfall, D.G., M.A. Henson, and E.P. Evans. 1978. The effect of soil sampling between collection and drying on nitrate concentration. Communications in Soil Science and Plant Analysis. 9:169-185.
- Davis, J.G., D.B. Bosley, R. Buhler, A.W. Cooley, T. Macklin, R.F. Meyer, F. Sobolik;
and K.V. Iversen. 1999. Comparison of soil testing laboratories. In
Proceedings of the Western Nutrient Management Conference. 3:4-5. March 4-5. Salt Lake City, Utah. Potash & Phosphate Institute, Brookings, South
Dakota. - Follett, R.H., and D.G. Westfall. 1986. A procedure for conducting fertilizer recommendation comparison studies. Journal of Agronomic Education. 15:27-29.
- Jacobsen, J.S., S.H. Lorbeer, B.E. Schaff, and C.A. Jones. 2002. Variation in soil fertility test results from selected Northern Great Plains laboratories. Communications in Soil Science and Plant Analysis. 33:303-319.
- Miller, R. 2013. Reliability of soil and plant analyses for making nutrient recommendations. Western Nutrient Management Conference. March 7-8, 2013. Reno,Nevada.
- Follett, R.H., D.G.Westfall, T.J. Doherty, E.E. Rothman, E.J. Langin, and H.M. Golis. 1984. Soil Test Recommendation Studies. Service in Action No. 511. Colorado State University, Extension Service, Fort Collins, Colorado, 1984.
- Carr, P.M., G.R. Carlson, J.S. Jacobsen, G.A. Nielsen, and E.O. Skogley. 1991. Farming soils, not fields: a strategy for increasing fertilizer profitability. Journal of Production Agriculture. 4:57-61.
Appendix
Extension Materials
- Developing Fertilizer Recommendations for Agriculture. Montana State University Extension Publication MT200703AG
- Fertilizer Guidelines for Montana Crops. Montana State University Extension Publication EB0161
- Interpretation of Soil Test Reports for Agriculture. Montana State University Extension Publication MT200702AG
- Site-Specific Management Guidelines. IPNI, International Plant Nutrition Institute. http://www.ipni.net/ssmg
- What is Site-specific Farming? North Dakota State University Extension Publication SF-1176-1
- Yield Mapping and Use of Yield Map Data. North Dakota State University Extension Publication SF-1176-3
Obtain the MSU Extension materials from:
MSU Extension Publications
P.O. Box 172040
Bozeman, MT 59717-2040
406-994-3273
https://extension-store.montana.edu
Media
- 4R Nutrient Stewardship – Overview. 2012. International Plant Nutrition Institute. CD. www.ipni.net
- 4R Plant Nutrition. 2012. International Plant Nutrition Institute. Book and CD. www.ipni.net
- Plant Nutrition and Soil Fertility Manual. 2nd ed. 2013. J. Benton Jones, Jr., CRC Press/Taylor & Francis Group, Boca Raton, Florida. 304 p.
- Site-Specific Management Guidelines. 2014. International Plant Nutrition Institute. A publication series on site-specific soil and crop management issues. www.ipni.net/ssmg
- Soil Fertility Manual. 2003. International Plant Nutrition Institute. 200 p. Book or CD. www.ipni.net
- Soil Science Step-by-Step Field Analysis. 2008. S. Logsdon, D.Clay, D. Moore, and T. Tsegaye [Eds.]. Soil Science Society of America. www.soils.org
- Soil Testing: Prospects for Improving Nutrient Recommendations. 1994. J.L. Havlin and J.S. Jacobsen. Soil Science Society of America Special Publication No. 40. 216 p. https://dl.sciencesocieties.org/publications/books/tocs/sssaspecialpubl/soiltestingpros
- Stewardship Specifics. 2013. International Plant Nutrition Institute. One page summaries of issues impacted by nutrient stewardship. www.ipni.net
- Western Fertilizer Handbook. 9th ed. 2002. Western Plant Health Association. Waveland Press. 356 p.
Web Resources
- http://landresources.montana.edu/soilfertility/ Clain Jones’ Extension Soil Fertility webpage with presentations, publications and
links to
information. - http://landresources.montana.edu/fertilizerfacts/ Fertilizer findings and recommendations based on MSU field research.
- http://landresources.montana.edu/nm/ Nutrient Management modules covering assorted soil nutrient topics.
- http://landresources.montana.edu/swm/ Soil and Water Management modules covering assorted soil and water topics..
- http://geoinfo.msl.mt.gov/Home/data/aerial_photographs_of_Montana.aspx Geographic Information Clearinghouse at the Montana State Library provides National Agricultural Imagery Program (NAIP) images to use with GIS or other image service viewers (http://gisservice.mt.gov/arcgis/rest/services/MSDI_Framework > MSDI_Framework/NAIP_2011/ImageServer).
- http://datagateway.nrcs.usda.gov/ Geospatial Data Gateway provides the Web Soil Survey (http://websoilsurvey.sc.egov.usda.gov/), National Agricultural Imagery Program (NAIP; www.fsa.usda.gov/FSA/apfoapp?area=home&subject=prog&topic=nai) aerial imagery, and other products.
- http://nationalmap.gov/ The National Map managed by USGS National Geospatial Program.
- http://ned.usgs.gov/ National Elevation Dataset (NED) feeds elevation data to The National Map project
- www.usgs.gov/pubprod/index.html USGS maps, imagery and publications.
- www.lidarbasemaps.org/ LIDAR Links for Mappers lists links to LIDAR map sources.
Laboratory Proficiency Programs
- Agricultural Laboratory Proficiency Program (ALP), www.collaborativetesting.com/store/main.aspx?DepartmentId=40
- North American Proficiency Testing Program (NAPT),www.naptprogram.org/
Soil, Plant and Water Analytical Labs for Montana Agriculture
(Italicized give recommendations based on Montana guidelines.)
- AgSource - Harris Laboratories
300 Speedway Circle
Lincoln, NE 68502
402-476-0300
http://agsource.crinet.com/page3777/ - Agvise Laboratories
604 Hwy 15 West
PO Box 510
Northwood, ND, 58267
701-587-6010
www.agvise.com - B & C Ag Consultants
315 S 26th St.
Billings, MT 59107
406-259-5779
www.bncag.com/ - CSU Soil Water & Plant Testing Laboratory
200 W Lake St
Campus Delivery 1120
Fort Collins, CO 80523-1120
970-491-5061
www.soiltestinglab.colostate.edu - Energy Laboratories, Inc.
P.O. Box 30916
Billings, MT 59107
406-252-6325 or 800-735-4489
www.energylab.com - Energy Laboratories, Inc.
3161 E Lyndale Ave
Helena, MT 59601
406-442-0771 or 877-472-0711
www.energylab.com - Midwest Laboratories, Inc.
13611 B Street
Omaha, NE 68144
402-334-7770
www.midwestlabs.com - MVTL Laboratories, Inc.
326 Center Street,
New Ulm, MN, 56073
800-782-3557
www.mvtl.com/
(The MVTL lab in Bismark, ND, does not do soil tests.) - Sathe Analytical Laboratory, Inc.
302 2nd St. W.
Williston, ND 58801
701-572-3632
sathelabs@nemont.net
(provide values without a recommendation) - Soil Testing Laboratory
North Dakota State University
1360 Bolley Dr.
Fargo, ND 58102
701-231-8942
www.ndsu.edu/soils/services/soil_testing_lab/ - University of Idaho
Analytical Sciences Laboratory
Holm Research Center
2222 W. Sixth St.
Moscow, ID 83844
208-885-7081
www.webpages.uidaho.edu/asl/
(provide values without a recommendation) - USU Analytical Lab
9400 Old Main Hill
Logan, UT 84322-4830
435-797-2217
www.usual.usu.edu - Manure Analysis Proficiency (MAP) labs are listed by MN Dept. of Ag at www2.mda.state.mn.us/webapp/lis/maplabs.jsp
Note: There are likely other laboratories in the Northern Great Plains that can meet your analytical needs.
Questions?
Contact Clain Jones, MSU Soil Fertility ExtensionSpecialist, clainj@montana.edu, 406-994-6076.
Acknowledgements
We would like to extend our utmost appreciation to the following who provided their time and insight to make this a better document:
- Paul Dixon, former Yellowstone County Extension Agent, Billings, MT
- Chuck Gatzemeier, CG Ag Consulting, Cut Bank, MT
- Grant Jackson, retired from Western Triangle Agricultural Research Center, Conrad, MT
- Dan Lucas, Granite County Extension Agent, Philipsburg, MT
- MSU Extension Communications & Publications for design and layout
We encourage the use of this document for nonprofit educational purposes. This document
may be reprinted for nonprofit educational purposes if no endorsement of a commercial
product, service or company is stated or implied, and if appropriate credit is given
to the author and MSU Extension. To use these documents in electronic formats, permission
must be sought from the Extension Communications Coordinator, 135 Culbertson Hall,
Montana State University, Bozeman MT 59717; E-mail: publications@montana.edu
The U.S. Department of Agriculture (USDA), Montana State University and Montana State
University Extension prohibit discrimination in all of their programs and activities
on the basis of race, color, national origin, gender, religion, age, disability, political
beliefs, sexual orientation, and marital and family status. Issued
in furtherance of cooperative extension work in agriculture and home economics, acts
of May 8 and June 30, 1914, in cooperation with the U.S. Department of Agriculture,
Cody Stone, Director of Extension, Montana State University, Bozeman, MT 59717.