
2015 Montana Cover Crop Survey Results
Dept. of Land Resources and Environmental Sciences, Montana State University
A printable version of this report is available, as is a copy of the survey used in this report.
Background
There is growing interest in the use of cover crops in Montana and surrounding states, yetlittle is known about why producers grow, or don’t grow, cover crops. In addition, there is scant information from the region on where growers obtain cover crop recommendations, what specific cover crop management practices they use, or what research questions they would like answered. As part of a larger USDA-WSARE grant on soil quality and agronomicresponses to cover crop mixtures (“cocktails”), Montana State University researchers developed a survey for Montana producers.
Methods
Producer names and addresses were obtained from the Farm Service Agency, through a Freedom of Information Act request. Duplicate names and addresses were removed, leaving approximately 25,000 individuals. 501 (2%) of those were randomly selected to receive the survey, of which 72 were either returned due to an incorrect address or because the producer no longer farms. Of the remaining surveys, 168 were filled out and returned, for a response rate of approximately 40%. An advance letter, reminder postcards, and a second survey mailing likely helped obtain this relatively high response rate. Based on the number of responses and the population size, the actual population response would be within ± 7.5% of the response we report.
Results and Discussion
There were 46 questions asking producers about their cover crop experiences, management, and perceptions. Here we report on a subset of questions with the focus on familiarity with cover crops, cover crop management, effects on subsequent cash crop, and barriers to adoption of cover cropping, to minimize the length of this report and to focus on areas we thought would be useful to most readers. Please contact Clain Jones (406 994-6076) if you would like to know responses to questions not addressed here.
Familiarity with Cover Crops
While summer fallow has long been practiced throughout the northern Great Plains as a means to conserve soil water, there has been increasing interest by producers to plant cover crops during the fallow period to increase soil quality. Producers in North Dakota have been enthusiastic supporters of cover crop mixtures, yet generally have more precipitation, making cover crops more viable. To get a sense of the background knowledge and cover crop adoption rates of producers in Montana, our survey included questions on familiarity with cover crops.
Nearly 30% of respondents had grown cover crops, with an almost equal split between single species and mixed species cover crops (Fig. 1).
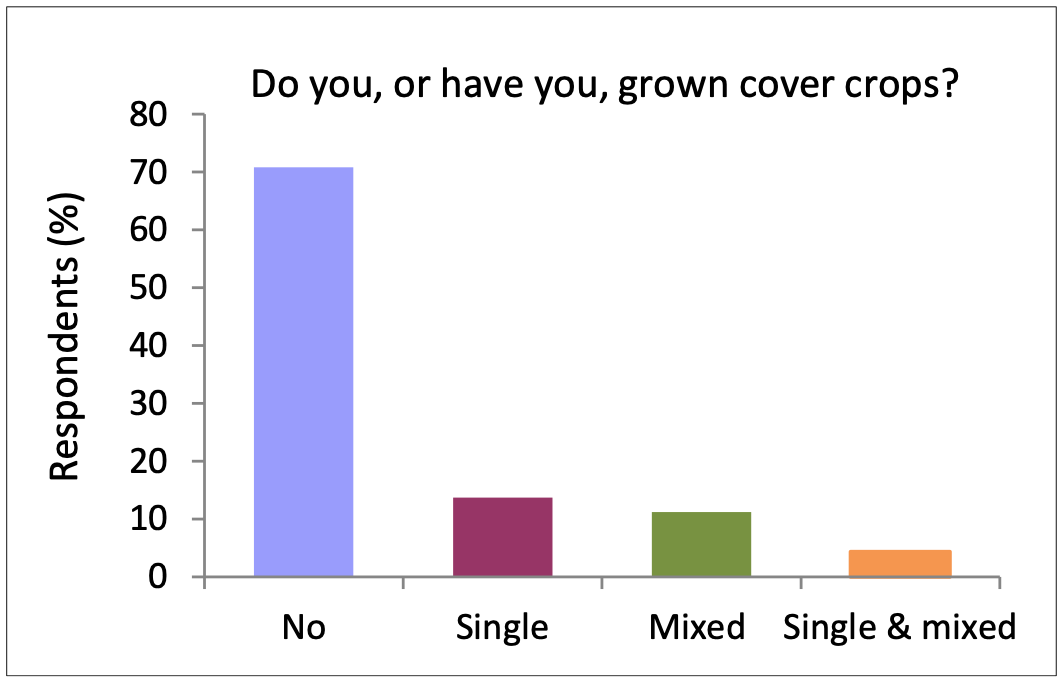
Figure 1.The majority of respondents have not grown cover crops. Number of respondents (N)=161
Cover crop mixtures, commonly known as cover crop cocktails, influence the potential benefits of cover crops through increased diversity. For example, inter-planted fibrous rooted grass plants, legumes, and tap-rooted plants are, respectively, well suited to add soil carbon, soil nitrogen, and minimize compaction and move nutrients upwards. The majorityof respondents (70%) had either never heard of cover crop mixtures or had minimal knowledge of them (Fig. 2). Of those who had tried mixtures, about 60% would likely try them again.
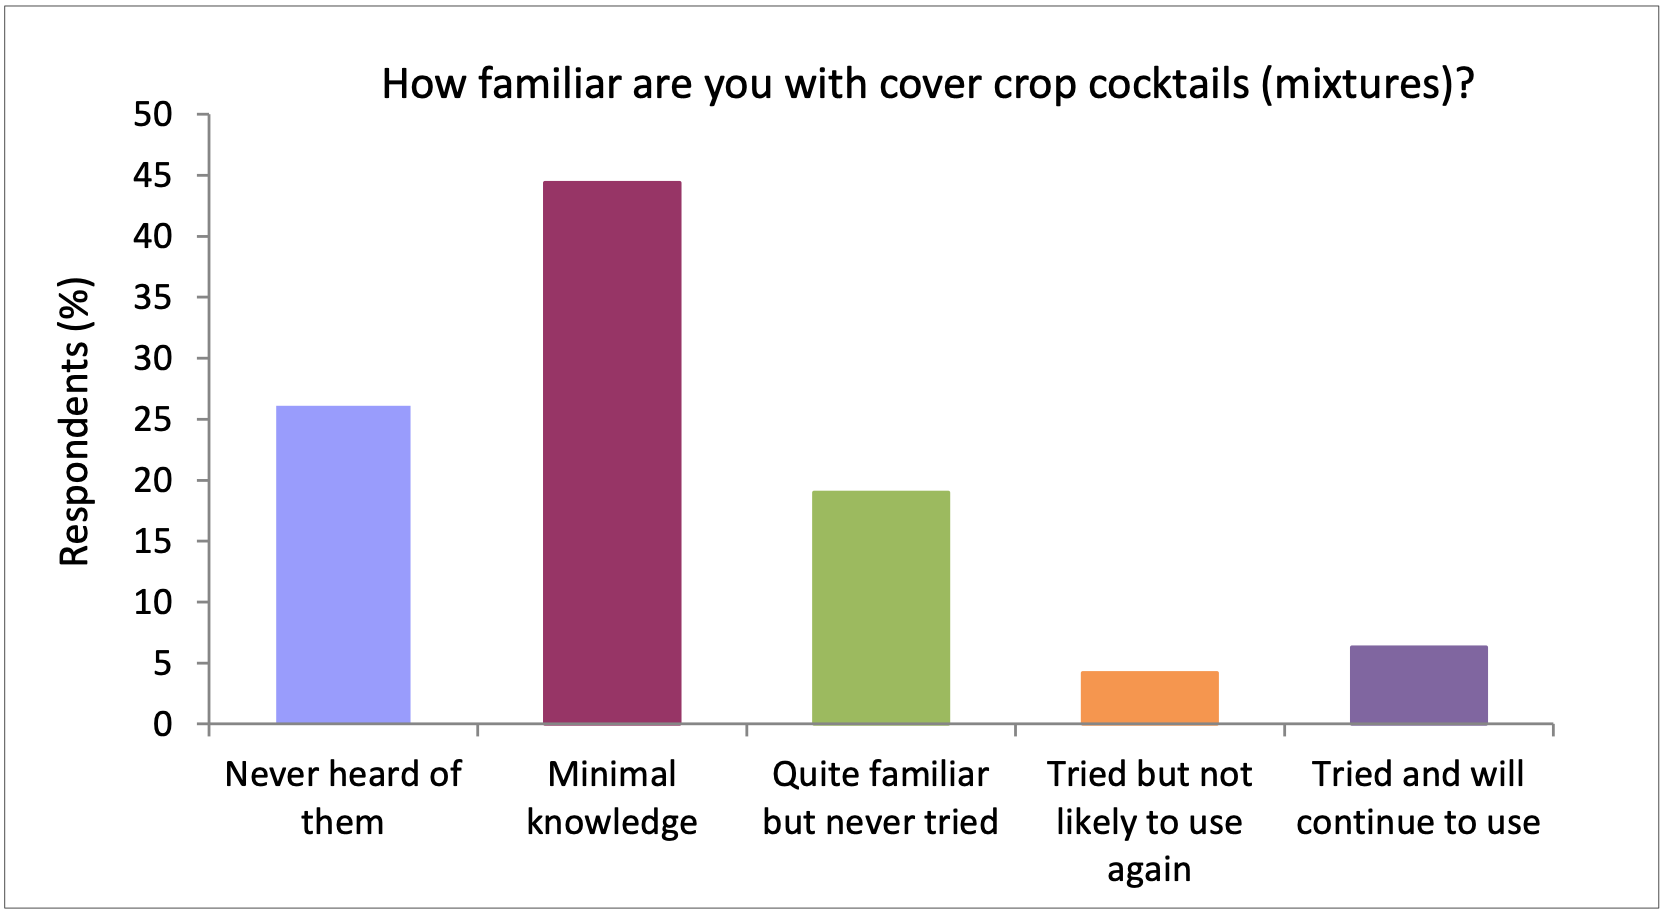 Figure 2.Most respondents had never heard of, or knew little about, cover crop cocktails. N=142
Cover Crop Management
Because management of cover crops will automatically take a back seat to managing cash crops, we expect that producers will likely adapt cover crop management to their specificoperations. To that end, we asked questions about when they use cover crops, timing of planting and termination, and species composition.
About 55% of respondents grew cover crops in the summer growing season, and 42% grew them in the shoulder season between harvest and winter (Fig. 3). Only about 12% grew cover crops in the winter months.
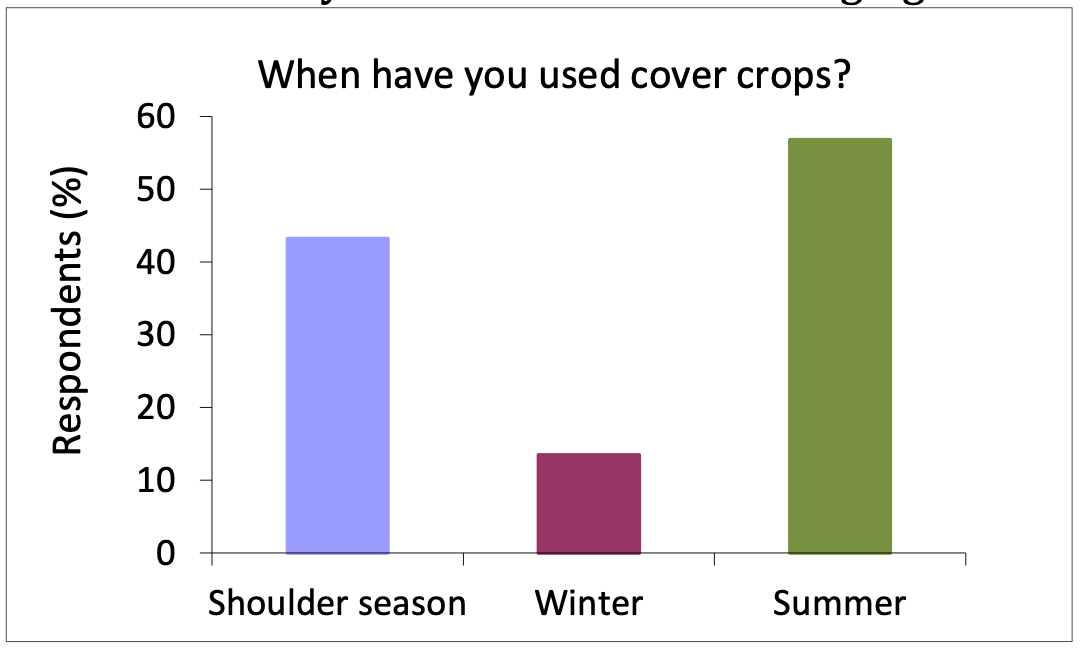 Figure 3.Summer was the most common cover crop growing period. N=37
The majority of respondents use three or fewer species when growing cover crops (Fig. 4). Species selection depends on producer needs and environmental variables on a site-by-site basis. Pea, turnip, radish, and lentil were listed most often as crops that farmers would grow again (Fig. 5). Although thesurvey didn’t query respondents for more details, it ispossible that radish and turnip are popular with cover crop growers because of relatively inexpensive seed and because of their potential to break up compacted layers. Pea and lentil are likely popularbecause they help fix nitrogen. All four are broadleaf crops, and thus add some diversity to cereal rotations.
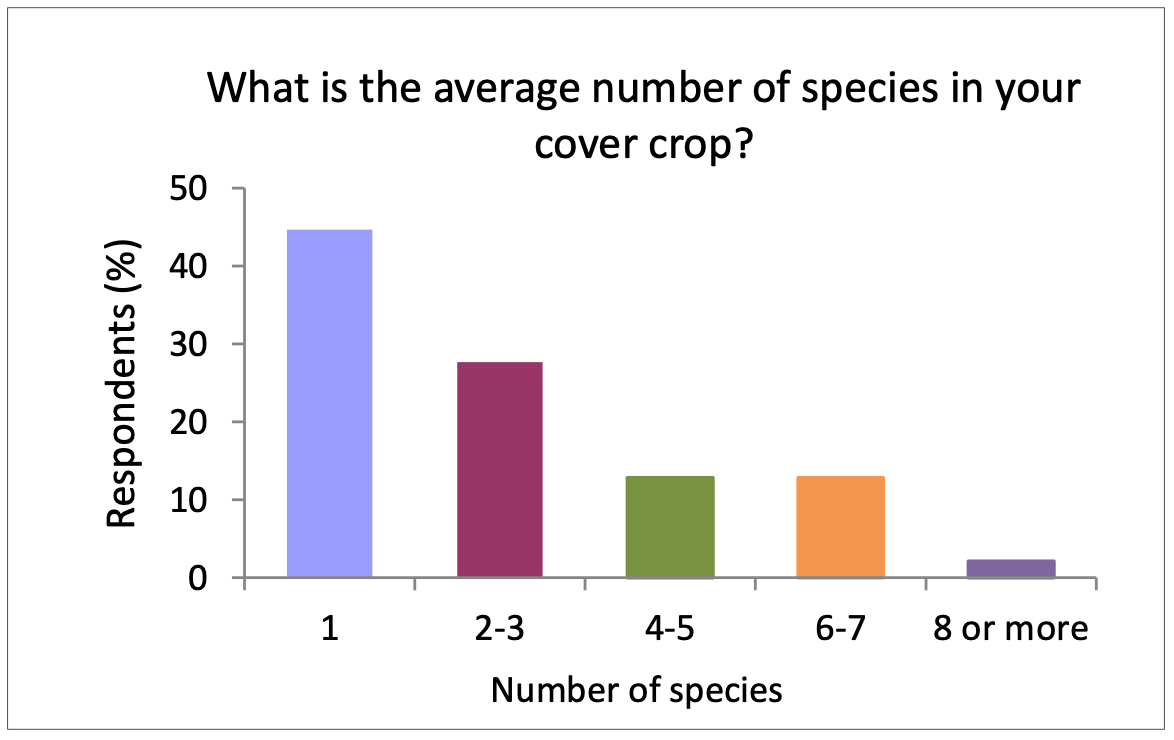 Figure 4.Nearly 50% of cover crop growers planted single- species, though about 25% planted
at least four species. N=47
Figure 4.Nearly 50% of cover crop growers planted single- species, though about 25% planted
at least four species. N=47
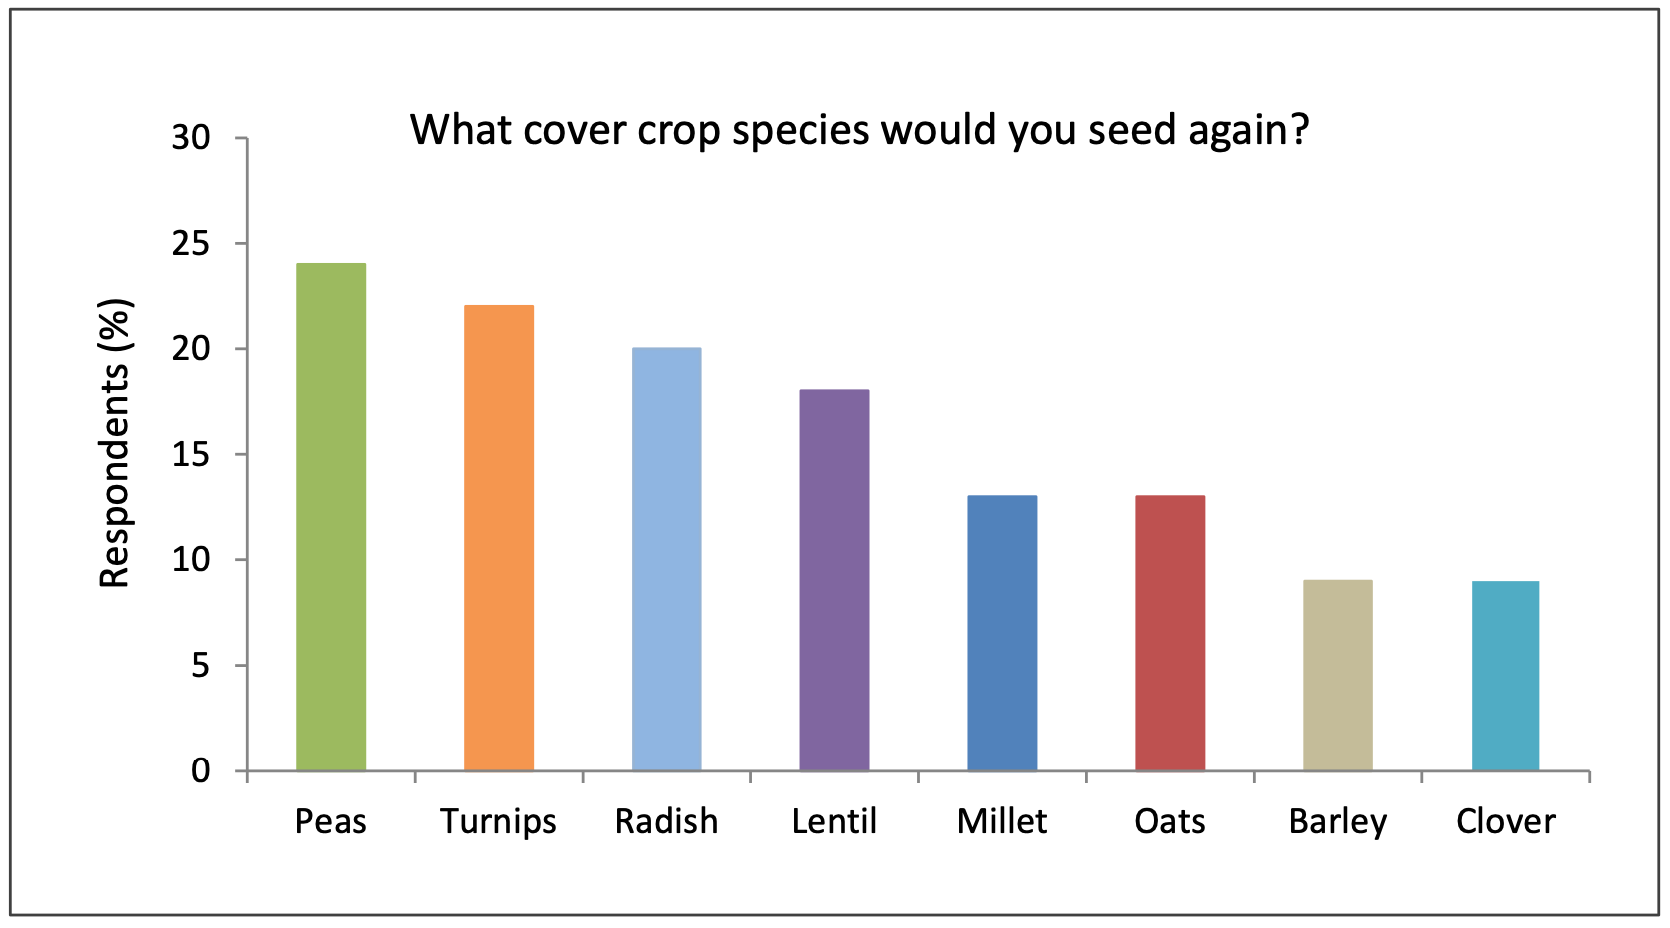 Figure 5.Other cover crops listed by 5% or fewer of the respondents include legumes, sudangrass,
rye, camelina, triticale, sunflower, safflower, sorghum, cereals, corn, small grains,
grasses, buckwheat, and NRCS custom mix. Answers add up to more than 100% because
respondents could select more than one answer. N=45
Figure 5.Other cover crops listed by 5% or fewer of the respondents include legumes, sudangrass,
rye, camelina, triticale, sunflower, safflower, sorghum, cereals, corn, small grains,
grasses, buckwheat, and NRCS custom mix. Answers add up to more than 100% because
respondents could select more than one answer. N=45
Interestingly, oat and radish were similarly popular as species that respondents would, or would not, plant again (Fig. 6). Both species can produce substantial biomass if fertilized, but poor biomass if not, so responses may partly reflect differences in fertilization or soil fertility. Few respondents who grow cover crops fertilize them (21%, N=47).
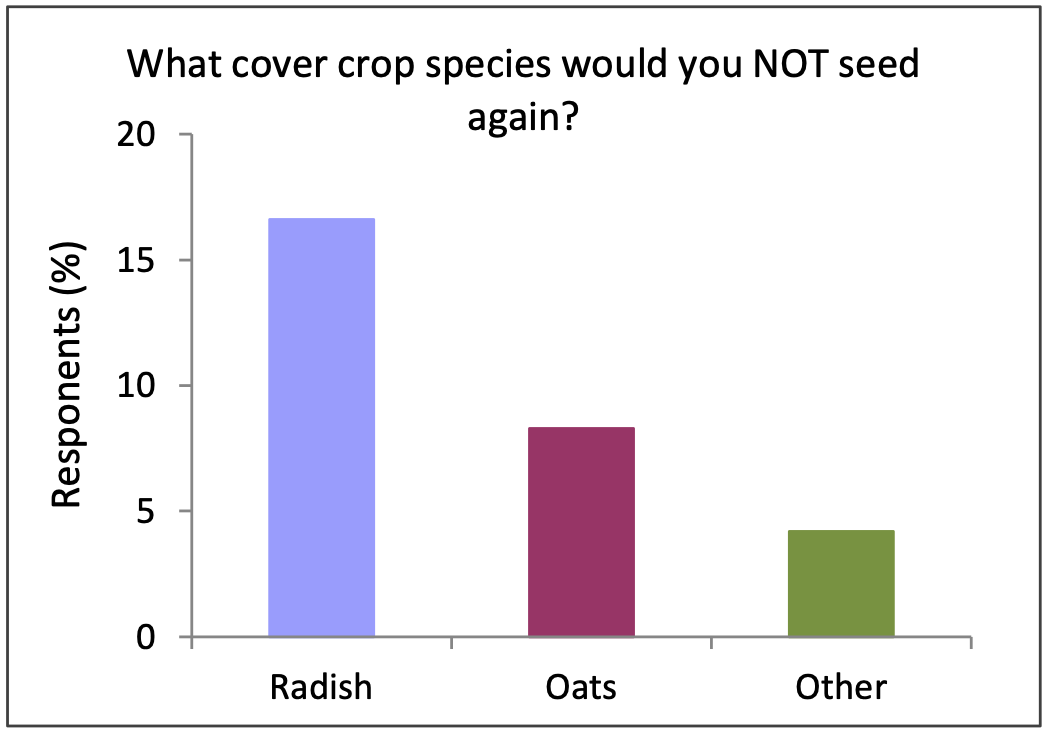 Figure 6.Other cover crops listed by 5% or fewer of the respondents include winter wheat, hay
forage, mustard, clover, barley, sunflower, phacelia, canola, buckwheat, lentils.
N=24
Figure 6.Other cover crops listed by 5% or fewer of the respondents include winter wheat, hay
forage, mustard, clover, barley, sunflower, phacelia, canola, buckwheat, lentils.
N=24
April and May were the most common months for seeding, followed closely by August (Fig. 7). Termination was most commonly completed in June and July. Spring-seeded cover crops were generally terminated in summer, and late summer seeded cover crops were terminated in fall. Seeding and termination dates were most often determined by the weather/season, preventing formation of mature seeds (for termination), or other crops,meaning either when there wasn’t an immediate cash crop managementneed or when a cash crop reached a certain growth stage (Fig. 8). Only rarely did insurance reasons or others' advice affect the decision on seeding or termination timing. Current RiskManagement Agency (RMA) regulations for crop insurance classify all cover crops as recrop, so crop insurance should not affect the decision of when to terminate unless this RMA rule changes.
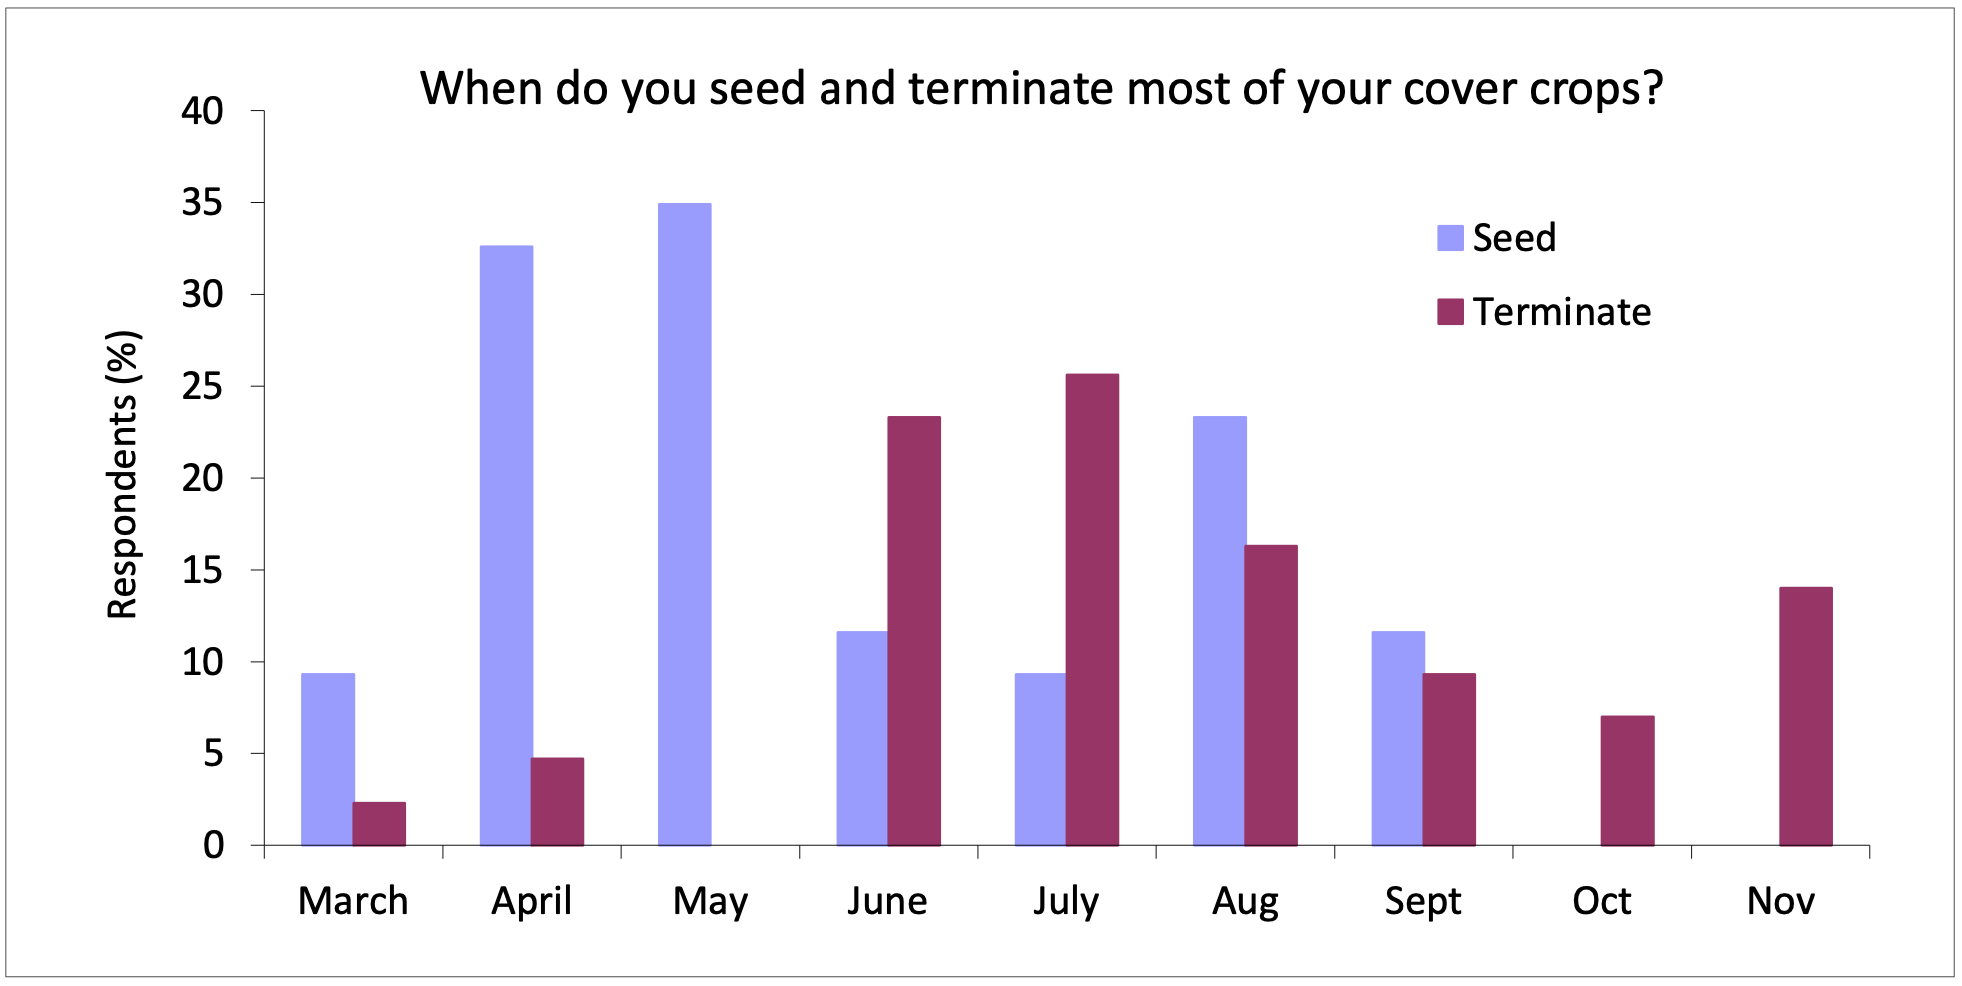
Figure 7. Answers add up to more than 100% because respondents could select more than one answer. N=43
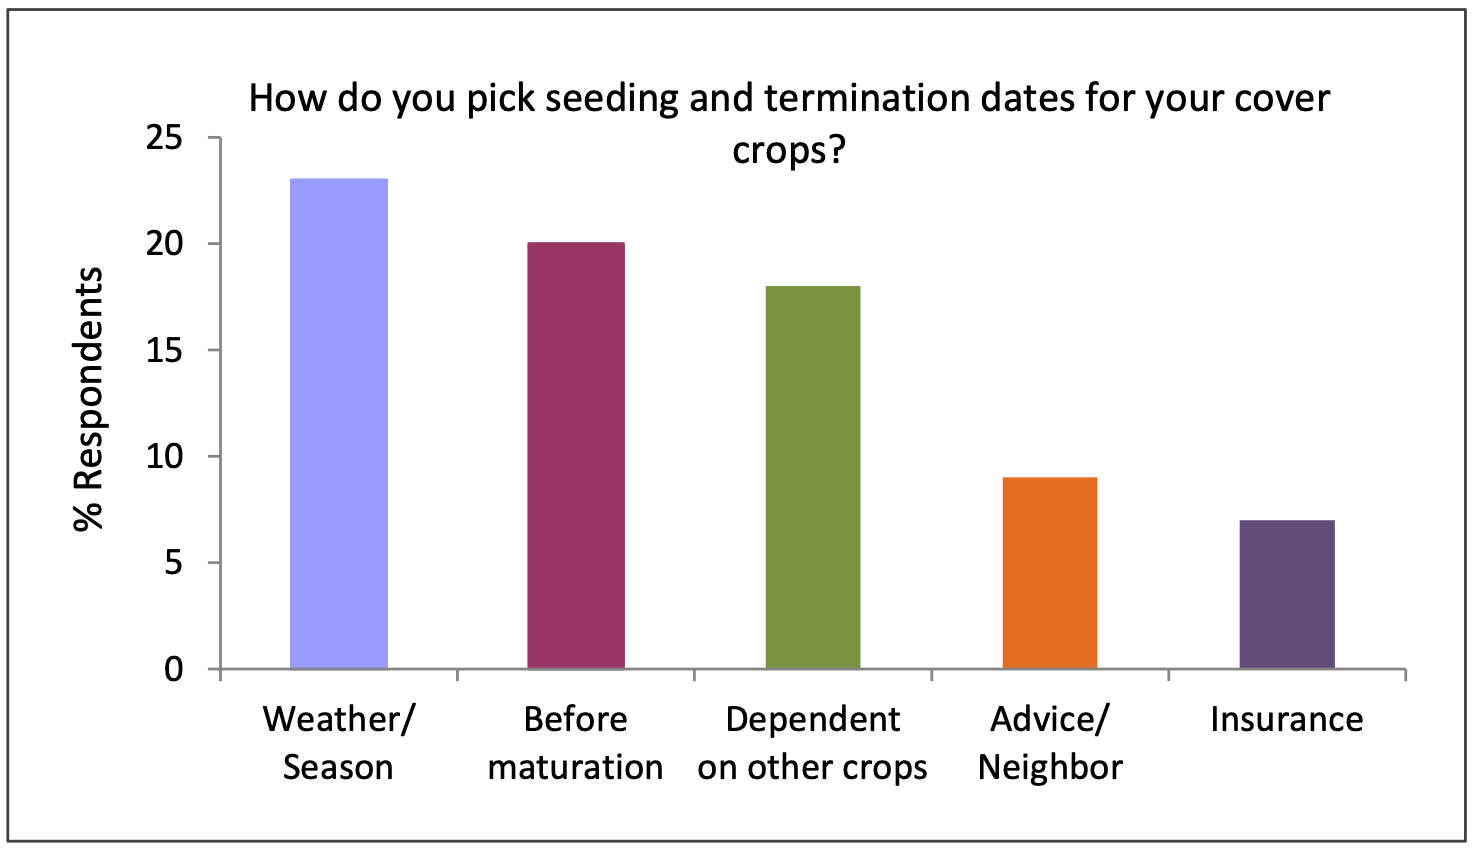
Figure 8. Cover crop growers used weather and crop stages most often when picking seeding and termination dates. N=44
Cover Crop Effects on Subsequent Cash Crop
If the logic behind summerfallow is to store soil water for an increase in subsequent cash crop yield, the effect of cover crops on soil water, and therefore the cash crop yield, is an important consideration for producers. Yield goals are used to adjust nitrogen fertilizer rates and yield goal changes would reflectproducers’ expectations forthe effect of cover crop on their cash crop. Nearly 70% of respondents do not change their yield goals after cover crops compared to after fallow, with the remainder equally split between those who decrease their yield goals and increase their yield goals (Fig. 9).
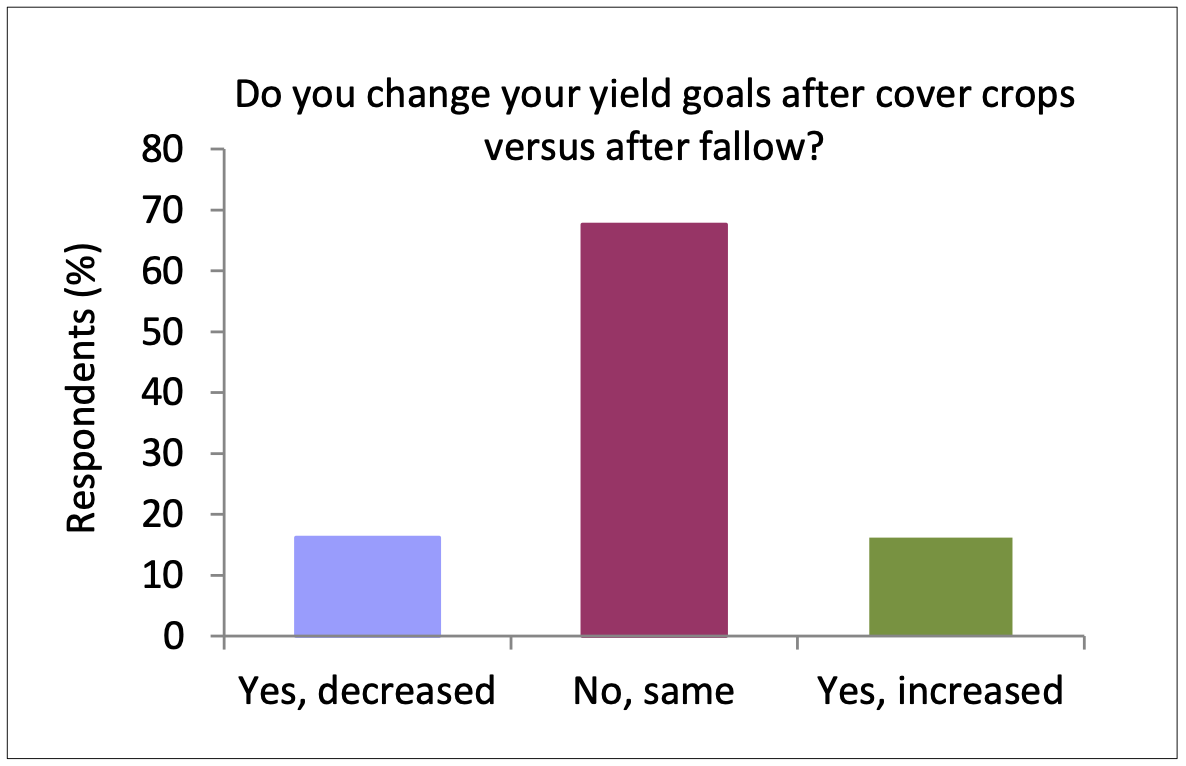 Figure 9.Only cover crop growers were asked to respond to this question. N=37
MSU research has generally found no-till wheat and barley yields are similar or lower after cover crops than after chemical fallow when grown only once (O’Dea et al. 2013; Burgess et al. 2014; Miller unpub. data) and similar or higher when grown for four cycles (Miller et al. 2015). Wheat and barley grown after one cycle of mixed cover crops averaged 13 bu/acre lower than after fallow in the current WSARE study on farmers’ fields http://mysare.sare.org/mySARE/ProjectReport.aspx?do=viewProj&pn=SW11-099(Table 2). This was attributed to allowing cover crops to approach seed set, using too much water and nitrogen. Most cover crop growers (62%) tested their soils to determine nitrogen rates after cover crops, yet most (70%) did not alter subsequent nitrogen fertilizer to account for nitrogen released from, or tied up by, cover crop residue (data not shown).
Adoption Barriers and Incentives
The overwhelming response that 90% of respondents who are currently growing cover crops would use them again (Fig. 10), contrasting with the small fraction of farmers using them (Fig. 1), could suggest that as people know more about cover crops, either 1) their experience with cover crops increases their level of comfort, or 2) they believe they have seen benefits from theiruse. It’s likely that farmers who wouldcontinue to grow cover crops had greatersuccess than those that won’t, perhaps because of different climate conditions or management practices that affected success. It appears that once producers try cover crops, a majority intend to continue (Fig. 10), although to a lesser extent when using mixed species (Fig. 2). The apparent preference for single species could reflect simpler management or perhaps better crop responses (e.g., N contribution by a legume cover crop).
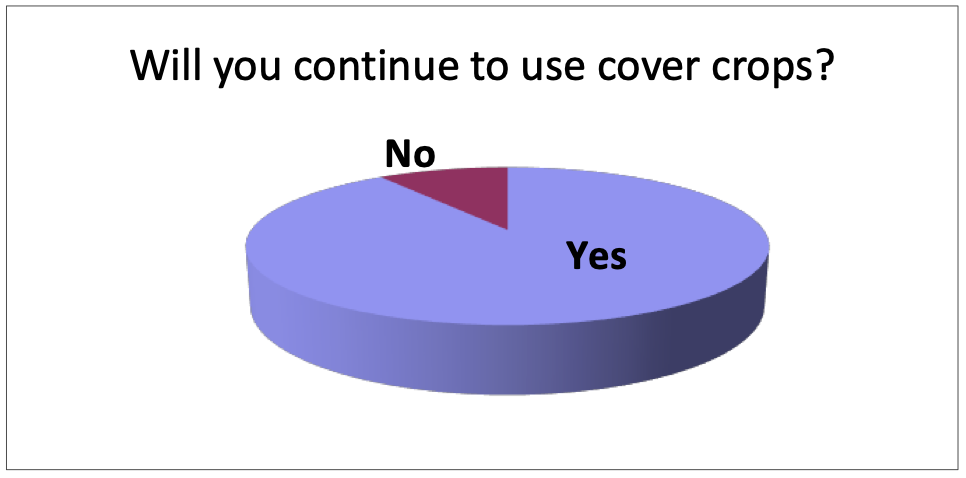 Figure 10.About 90% of cover crop growers would continue to use them. N=41
Despite the finding that the vast majority of cover crop growers will continue to grow them, acreage increases over the past three years have not quite counteracted acreage decreases(Fig. 11). It’s possible that some NRCS contractsreached their 3-year limit and/or that those discontinuing were the larger acreage growers.
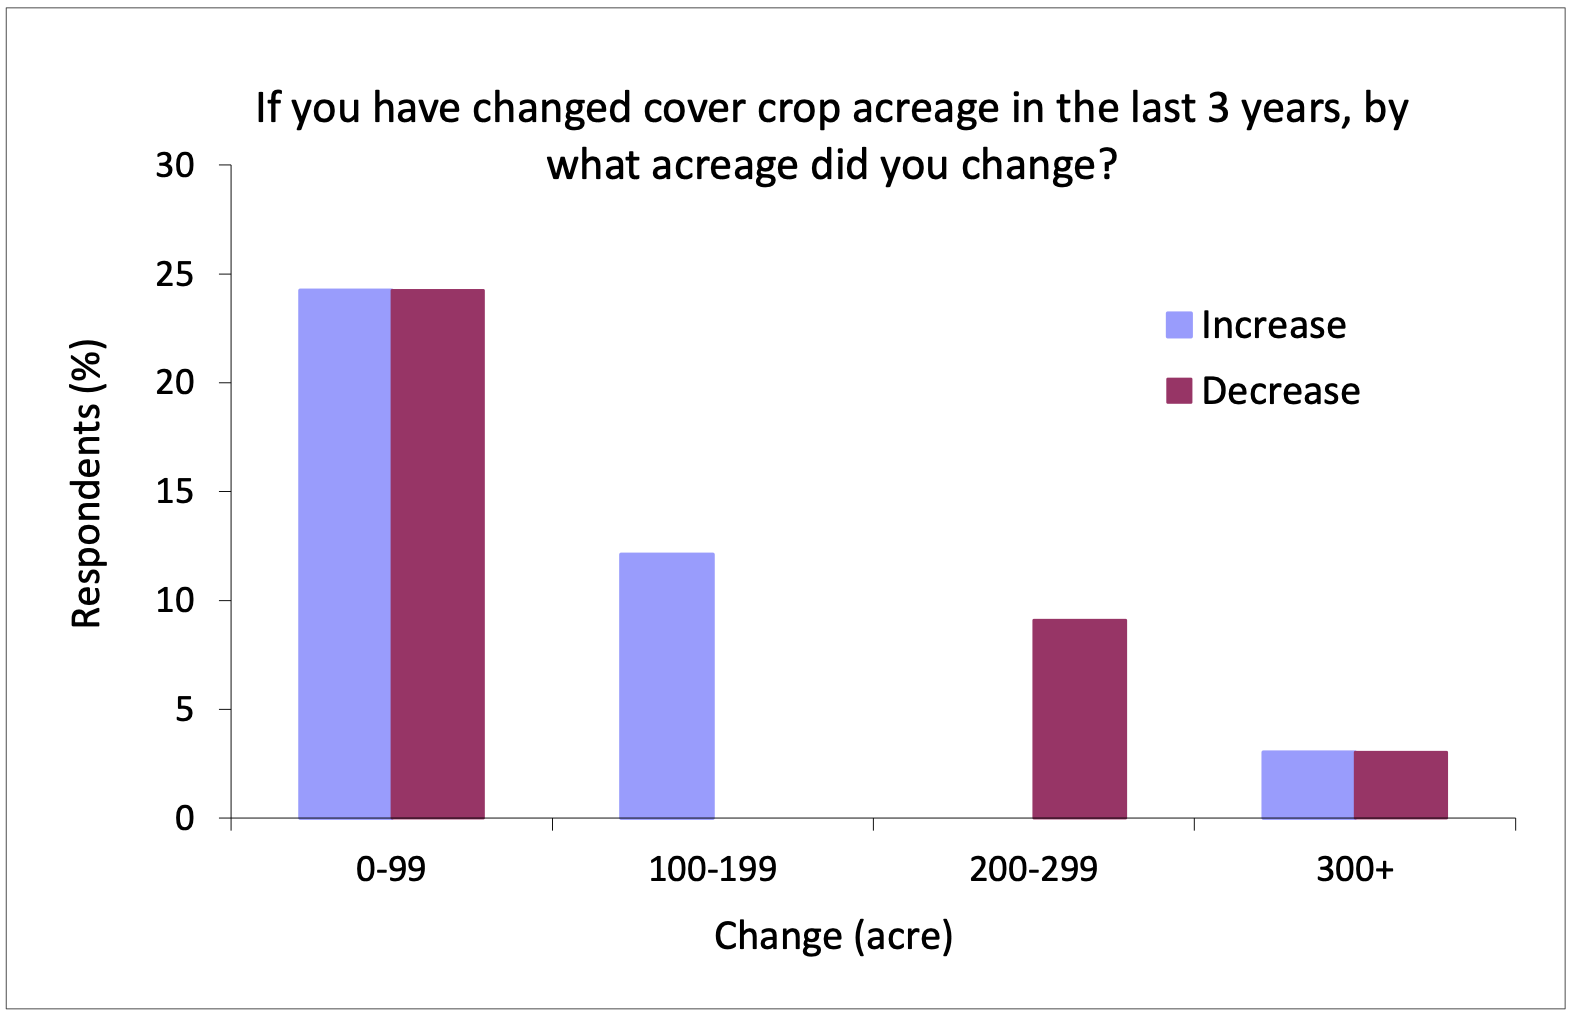 Figure 11.Cover crop acreage increases have not quite offset acreage decreases. N=33
Nearly 12% of cover crop growers stated that they intend to increase acreage by 300 acres or more (Fig. 12). This response could imply 1) a high success rate with the respondents who have grown cover crops, or 2) increased awareness of incentive programs and willingness to enroll in those programs. The net cover crop acreage increase of all cover crop growing respondents was about 6,000 acres. Assuming conservatively that there was 100% survey bias, meaning all cover crop growers returned the survey, this would represent a sizeable acreage increase in Montana (~300,000 acres over three years) and substantially more if there was no bias. This planned acreage increase needs to be tempered with actual reported acreage increases in past three years (Fig. 11), possibly suggesting plans don’t always become reality, likely due to competingpriorities.
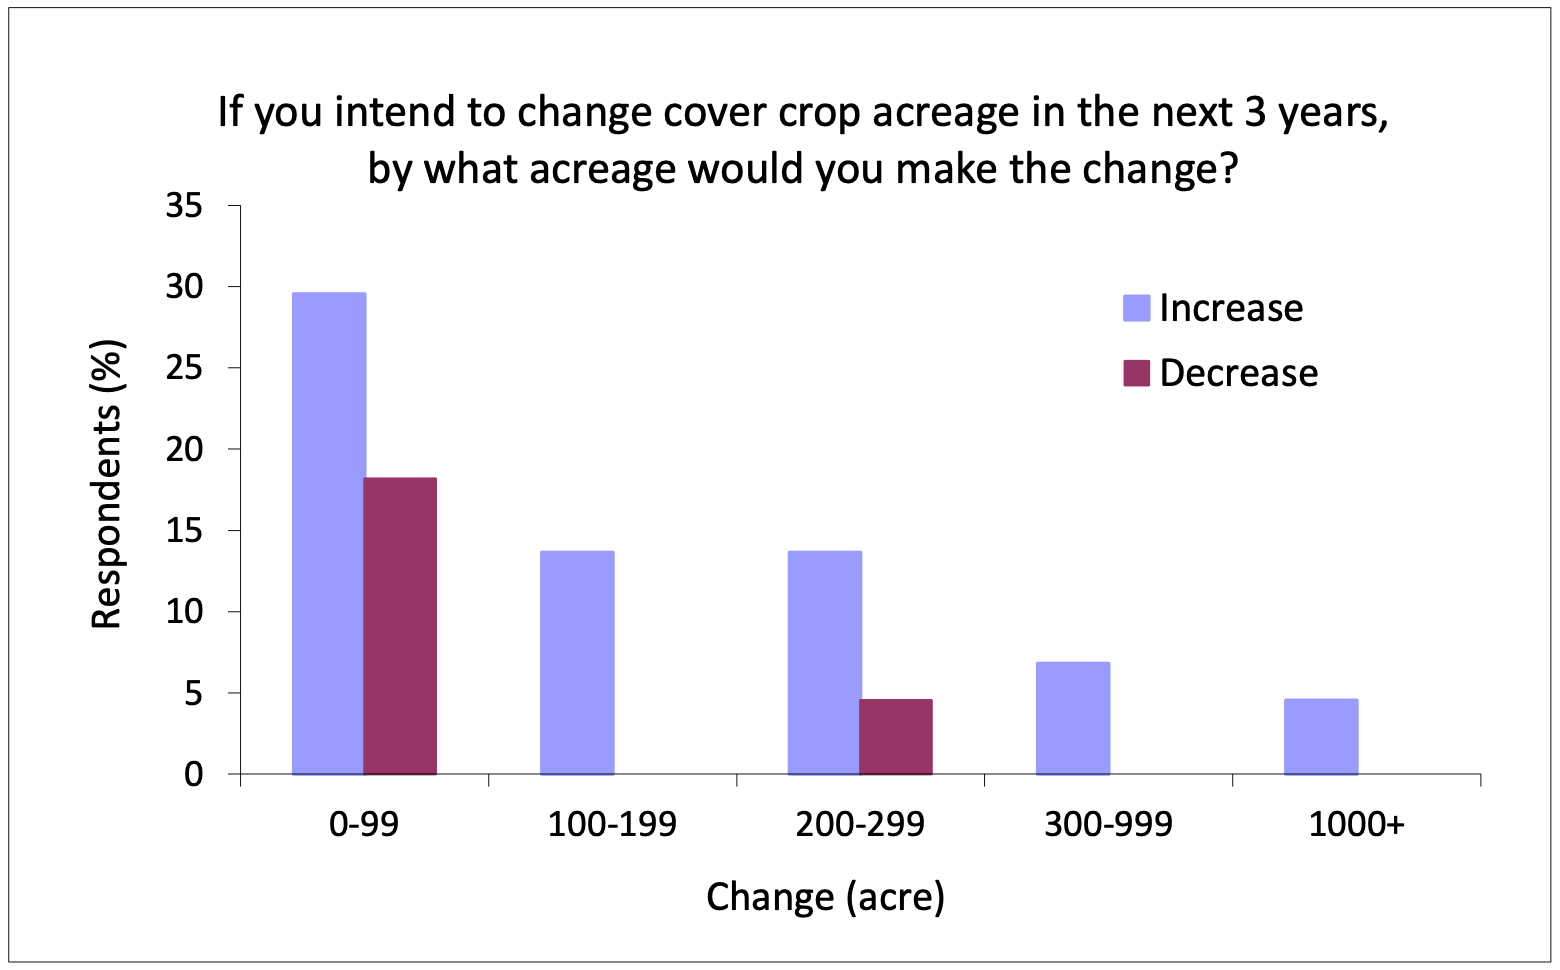 Figure 12.Far more cover crop growers planned to increase acreage, than decrease acreage. N=44
A slight majority of cover crop growers were willing to invest in cover crops without a return on investment in the year after their cover crop (Fig. 13). This suggests desire to increase soil health, possibly for long-term economic benefit.
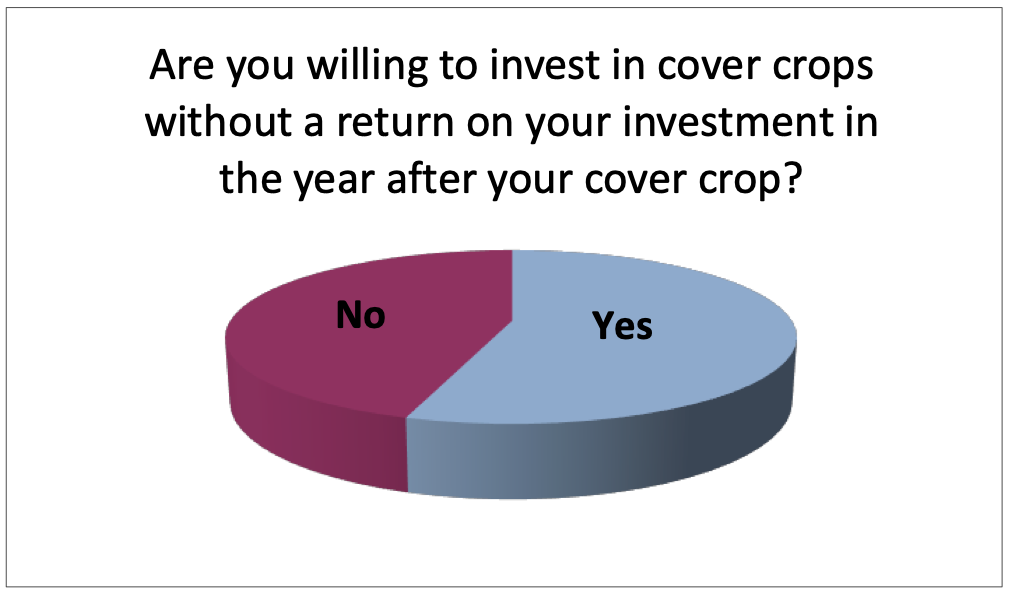 Figure 13.Only cover crop growers were asked to respond to this question. N=40
On average, cover crop growers were willing to invest in cover crops for 2.1 ± 1.7 years without a profit (Fig. 14). In contrast, without NRCS payments, it took 8 to 10 years for pea cover crop- wheat net returns to match or exceed fallow-wheat net returns (Miller et al. 2015).
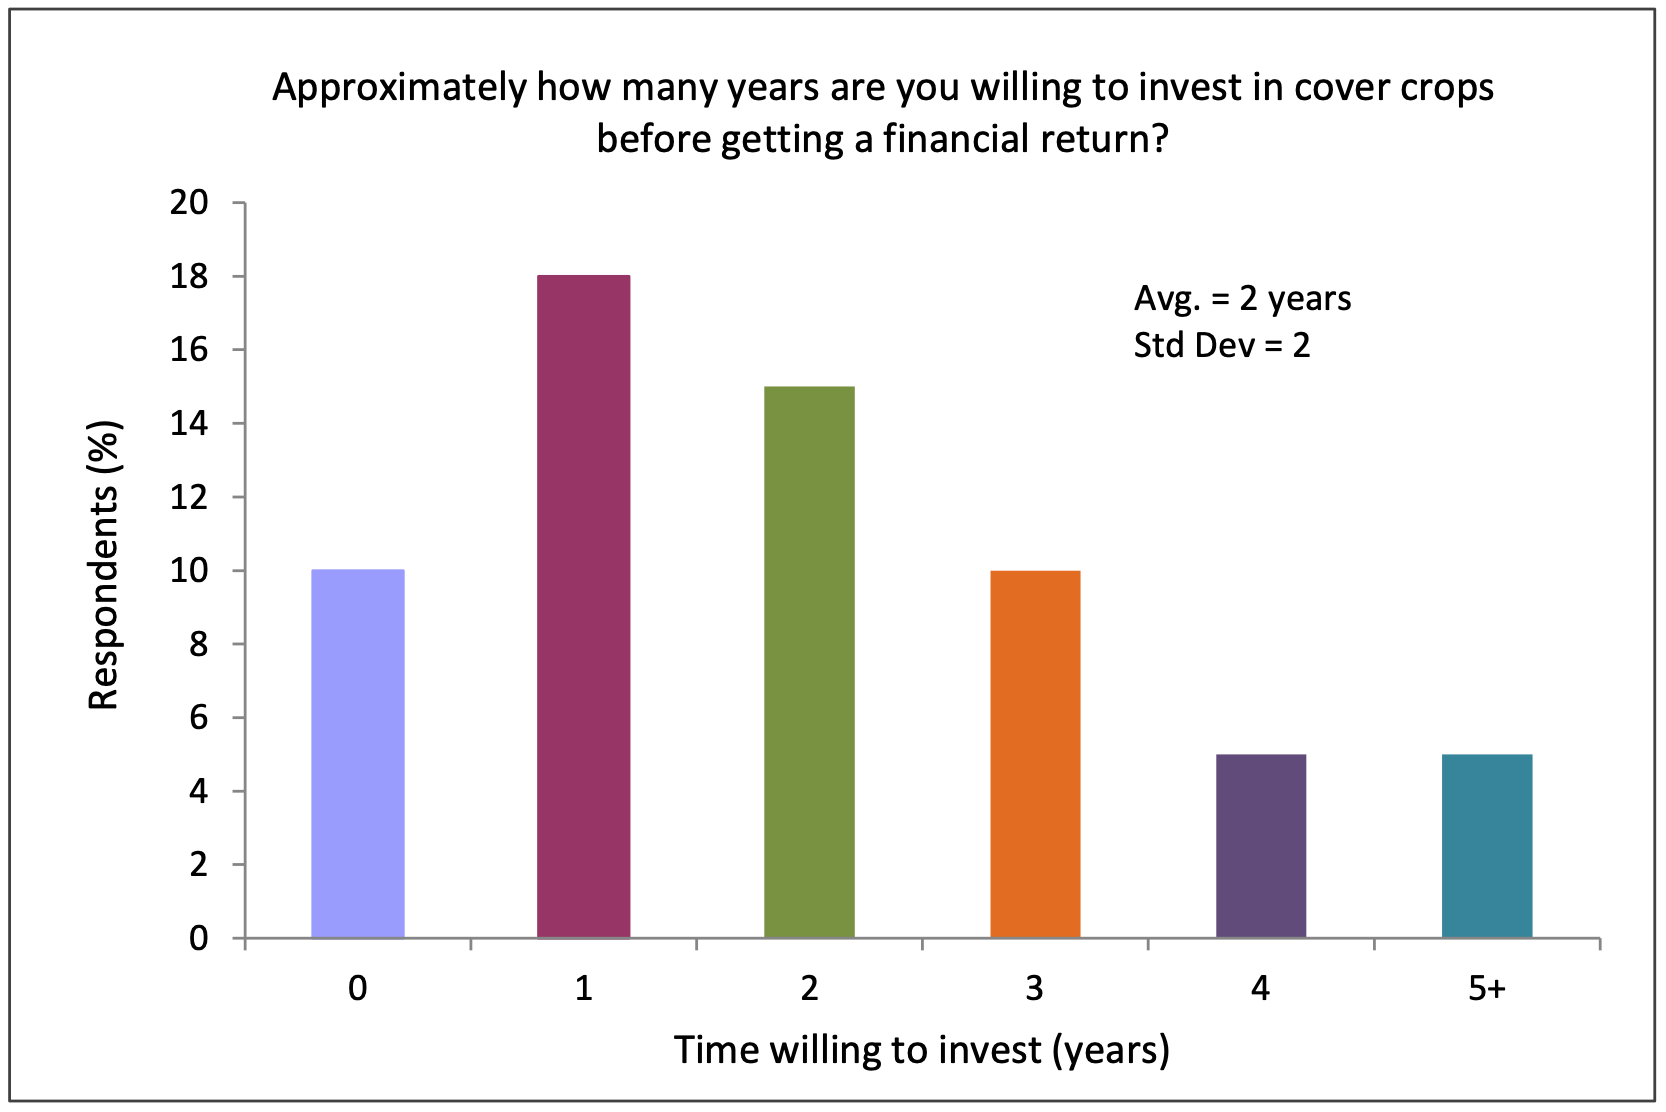 Figure 14.Only cover crop growers were asked to respond to this question. N=39
One respondent who was willing to wait a year without a financial returnexpressed that they are "tryingfor fiveyears before making judgment”.Another respondent who was willing towait fiveyears for financial return hoped to “see a healthier soil profile” by the end of their5-year CRP contract.
The vast majority of respondents(72%) weren’t willing to spendmore than $20/acre on seed (Fig. 15). This goal is certainly possible but depends on seed source and species selection. Respondents were willing to spend somewhat more for planting and terminating cover crops, though the responses were "bimodal" meaning 8% weren’twilling to spend more than $30/acre, none said $31 to $74/acre, and the remaining 12% were willing to spend from $75 to $100/acre (Fig. 16) . We speculated that the large range of responses may have reflected that some were receiving NRCS EQIP payments for growing mixed cover crops and others were not. On conventional farms, these payments in 2015 ranged from about $37/acre for growing simple mixes (one to four species) to about $52/acre for growing five or more species. Organic farmers could receiveabout $80/acre for growing cover crop mixtures. However, those who did receive incentive payments are willing to spend about the same ($21/acre, N=12) as those who didn't ($19/acre, N=25).
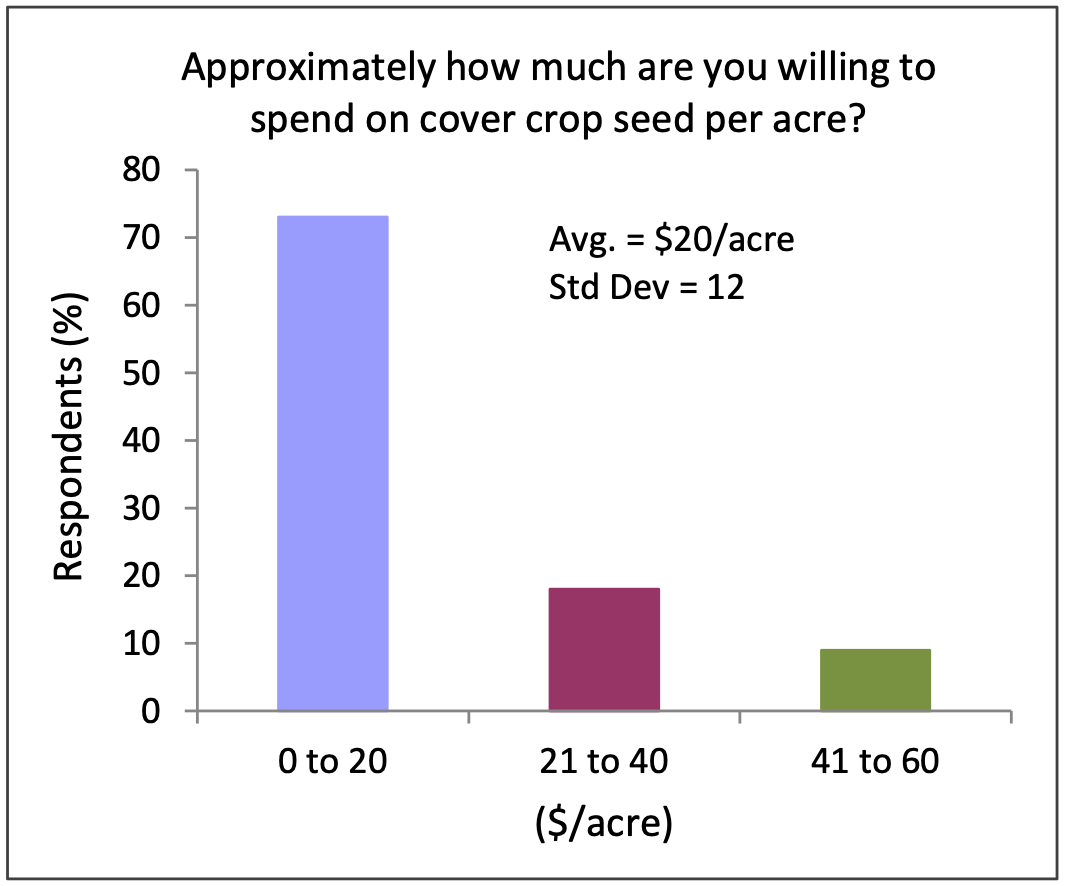 Figure 15.Only cover crop growers were asked to respond to this question. N=39
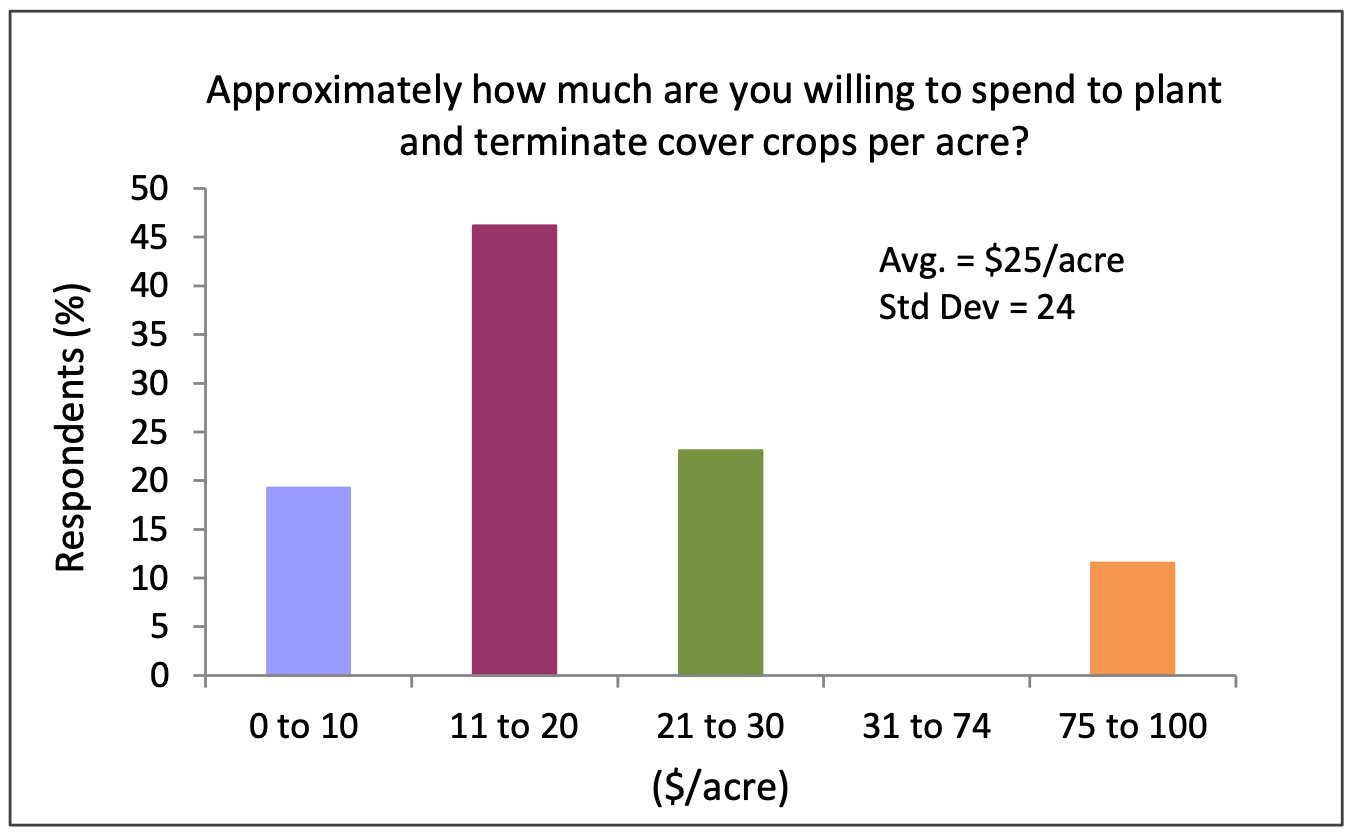
Figure 16.Only cover crop growers were asked to respond to this question. N=34
Approximately 60% of respondents felt that long-term soil health was a very important reason for planting cover crops, compared to only 25% and 45% of respondents who felt short-term and long-term economics, respectively, were very important (Fig 17). In fact, long-term soil health was selected as “very important” by more respondents than any other factor including reduced pests, increased water availability, and increased nitrogen availability. Short-term economics, land value, insect management, forage, and increased availability of nutrients other than nitrogen were all selected by less than 45% to be very important considerations for planting cover crops.
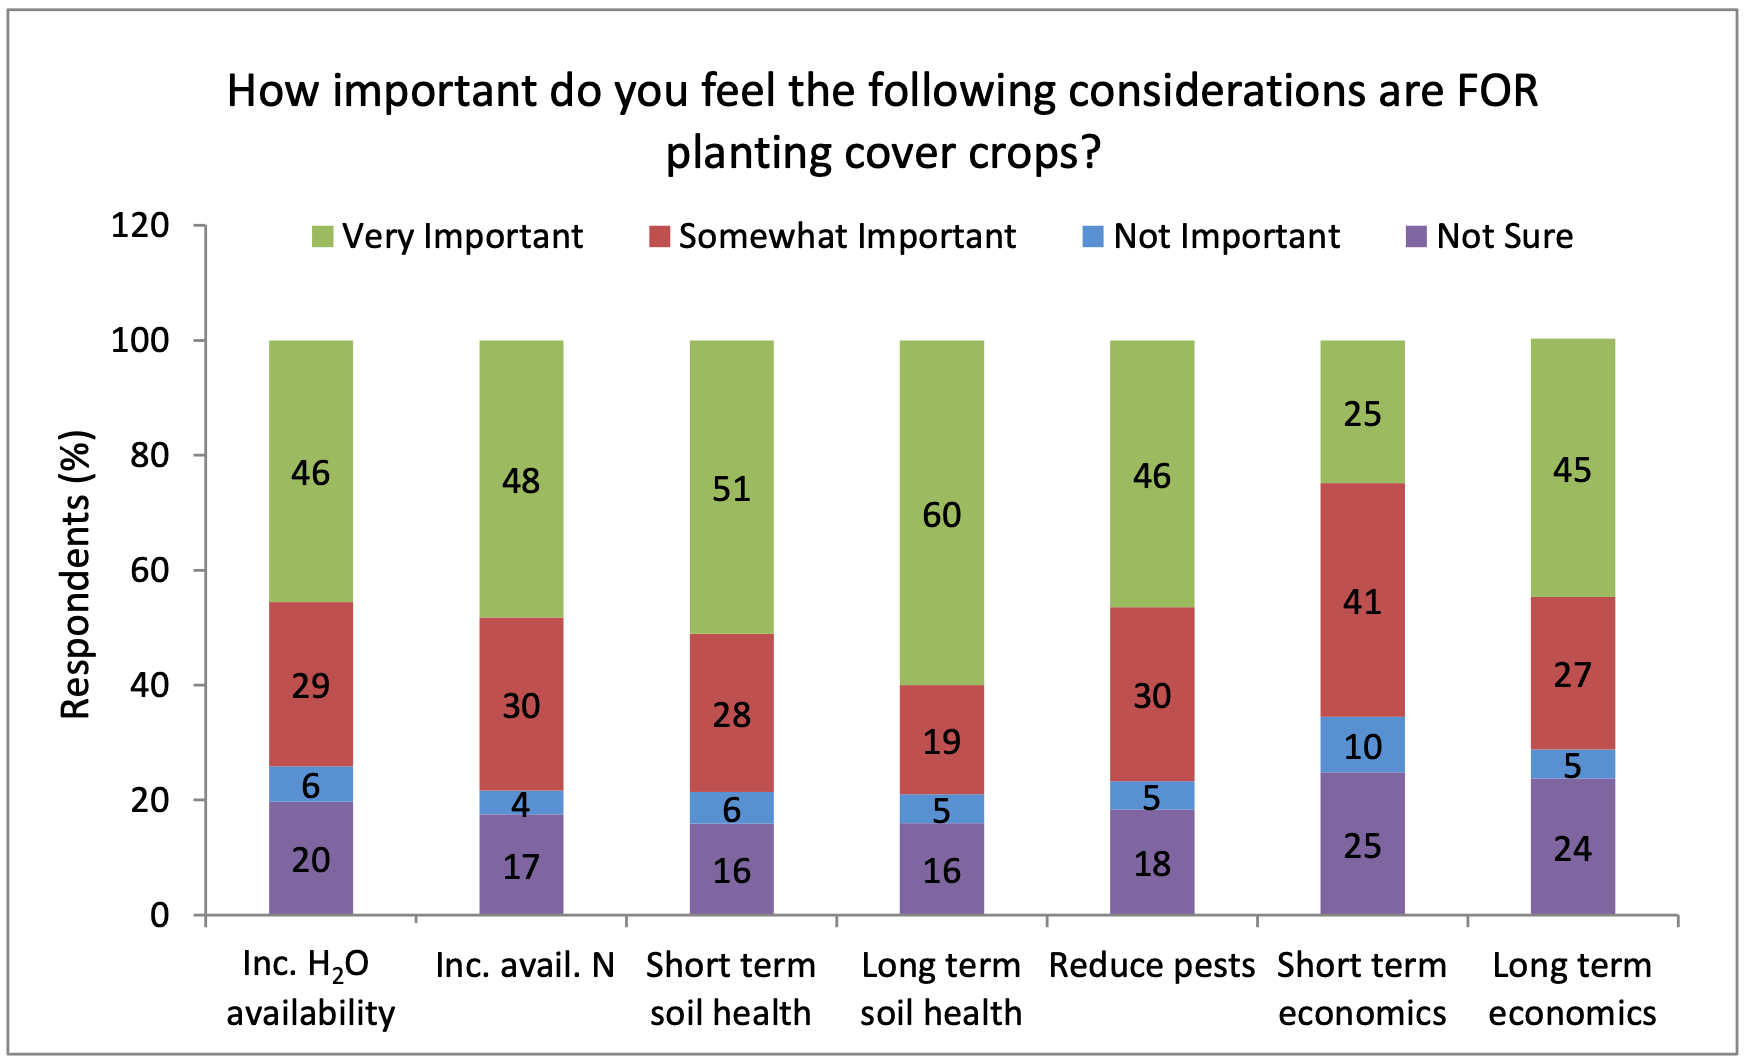 Figure 17.The whole respondent list was asked to answer this question. N=148
Respondents were given the options to list any "other" important factors in considering cover crops. Some listed several factors such as "water is our yield limiter, O.M. would be main focus, resistant weeds and chemical costs are drivers".
Although 45% of producers who grow cover crops use them for grazing (Fig. 18), only
28% said forage production
is, or would be, the main reason to plant cover crops (Fig. 19). Nearly half of all
respondents selected soil health as the top reason to plant, or consider planting,
cover crops. Five of the top six reasons listed (soil health, water conservation,
forage, nutrient input, and pest management), suggest that respondents are choosing
to enlist cover crops as creative management strategies.
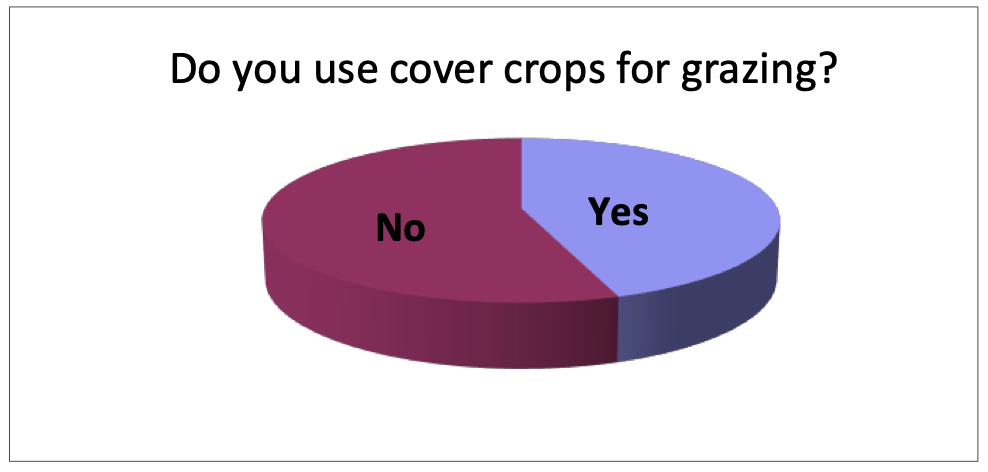 Figure 18.Of those growing cover crops, 45% were grazing them. N=47
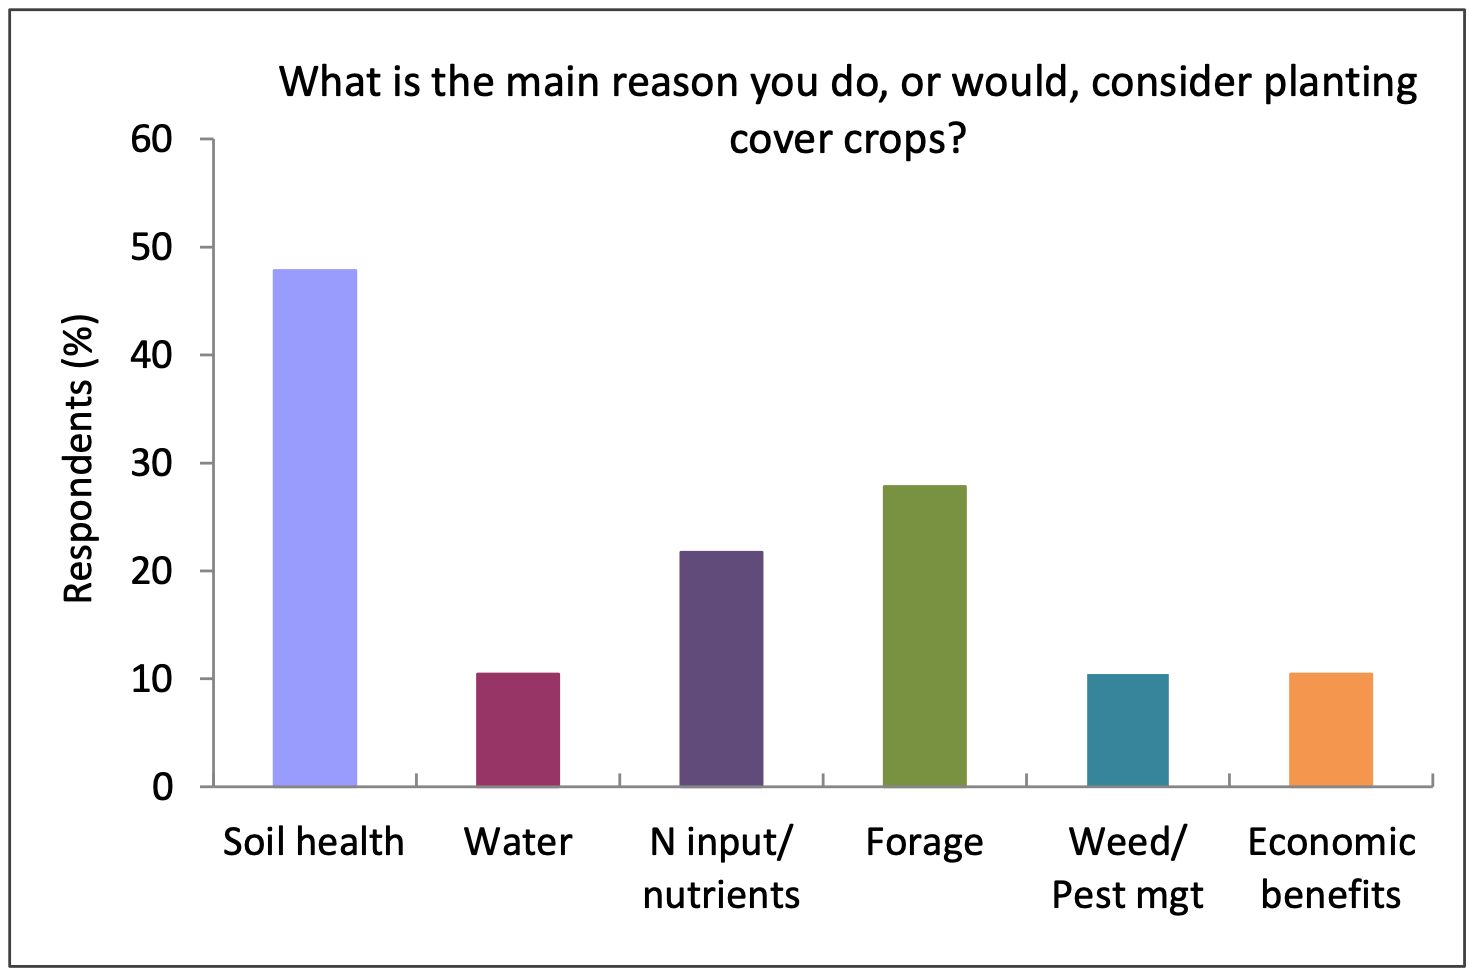 Figure 19.Reasons listed by 7% or fewer of the respondents include crop rotation, program incentives,
reduce fallow, none, don't know, and sustainability. All respondents were asked to
answer this question. N=130
Figure 19.Reasons listed by 7% or fewer of the respondents include crop rotation, program incentives,
reduce fallow, none, don't know, and sustainability. All respondents were asked to
answer this question. N=130
Economic and agronomic issues were the main reasons listed for quitting use of cover crops (Fig. 20). Respondents who saw issues with cash crops reported increased weeds, issues with seeding, decreased water availability, and increased competition, all affecting the overall cash crop yield.
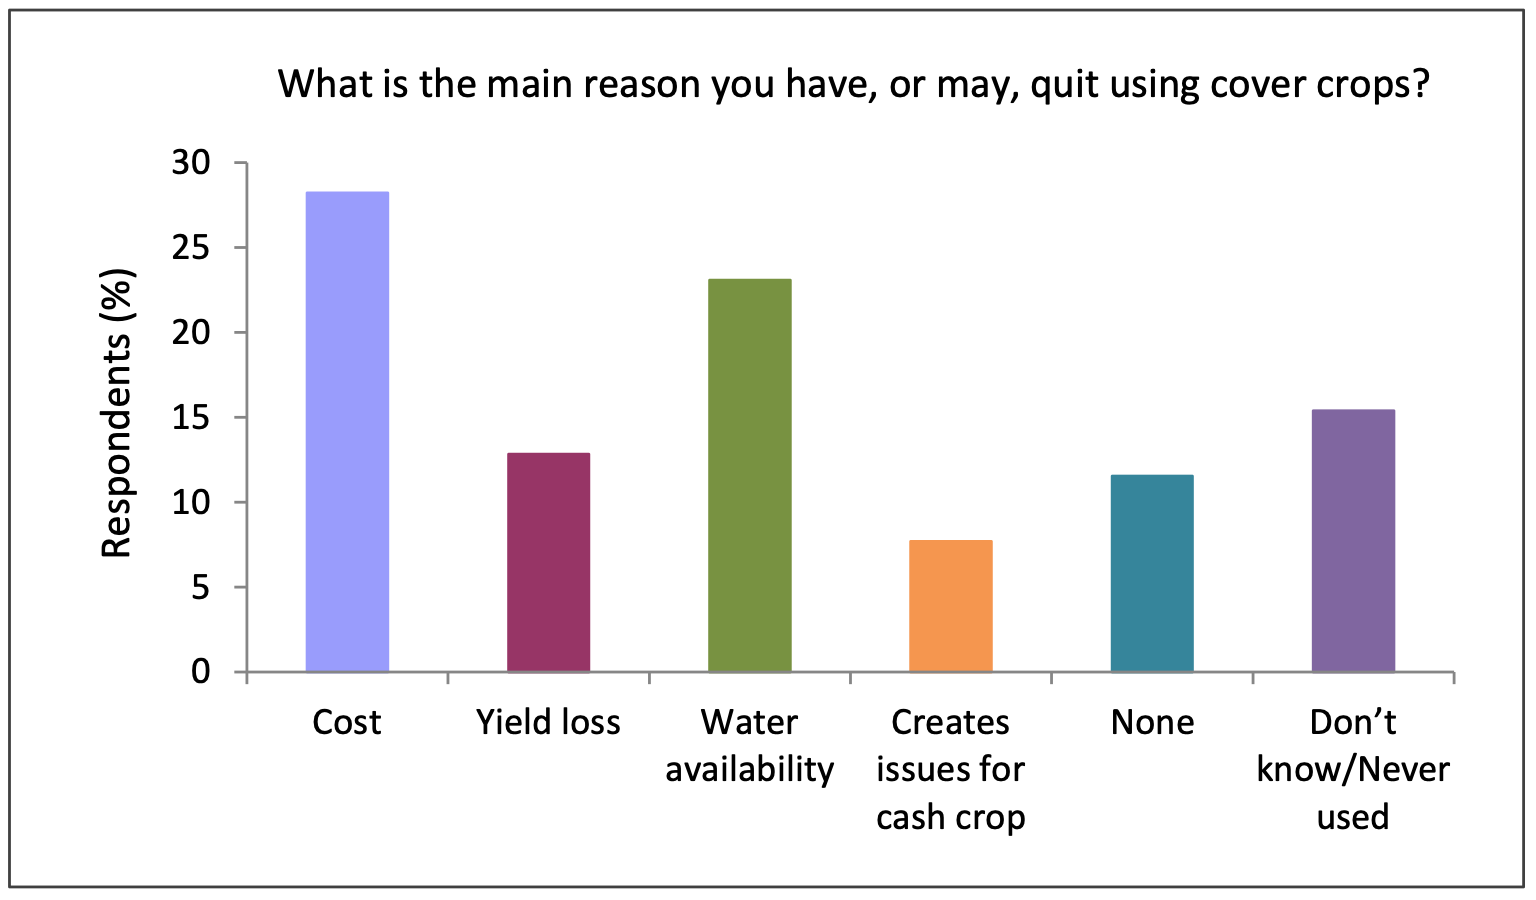 Figure 20.All respondents were asked to answer this question (hypothetical for non-cover crop
growers) with short answer responses. Reasons listed for quitting use of cover crops
by 5% or fewer of the respondents include unfamiliar with them or lack of knowledge,
lack of equipment, lack of time, difficulty with cover crop, crop insurance, and soil
disturbance. N=98
Figure 20.All respondents were asked to answer this question (hypothetical for non-cover crop
growers) with short answer responses. Reasons listed for quitting use of cover crops
by 5% or fewer of the respondents include unfamiliar with them or lack of knowledge,
lack of equipment, lack of time, difficulty with cover crop, crop insurance, and soil
disturbance. N=98
One respondent expressed frustration with a lack of willingness and cooperation from decision-making family members. Other respondents’ comments included: “not familiar enough and see neighbors struggle with them”, “cost without benefit”, and “robbing water and nutrients”.
Close to 50% of respondents were unsure how much benefit (e.g., nutrient availability, soil health, economic return) a cover crop mixture has over a single species cover crop (Fig. 21). Only about 2–5% thought it was unlikely that there would be a benefit of mixtures, whereas at least 16% thought it was very likely that there would be a benefit of mixtures to nitrogen and other nutrient availability, soil health, long-term economic gain and increased forage (possibly from increased quality of mixtures). Approximately 52% felt that cover crop mixtures would likely improve short-term and long-term soil health more than single species cover crops.
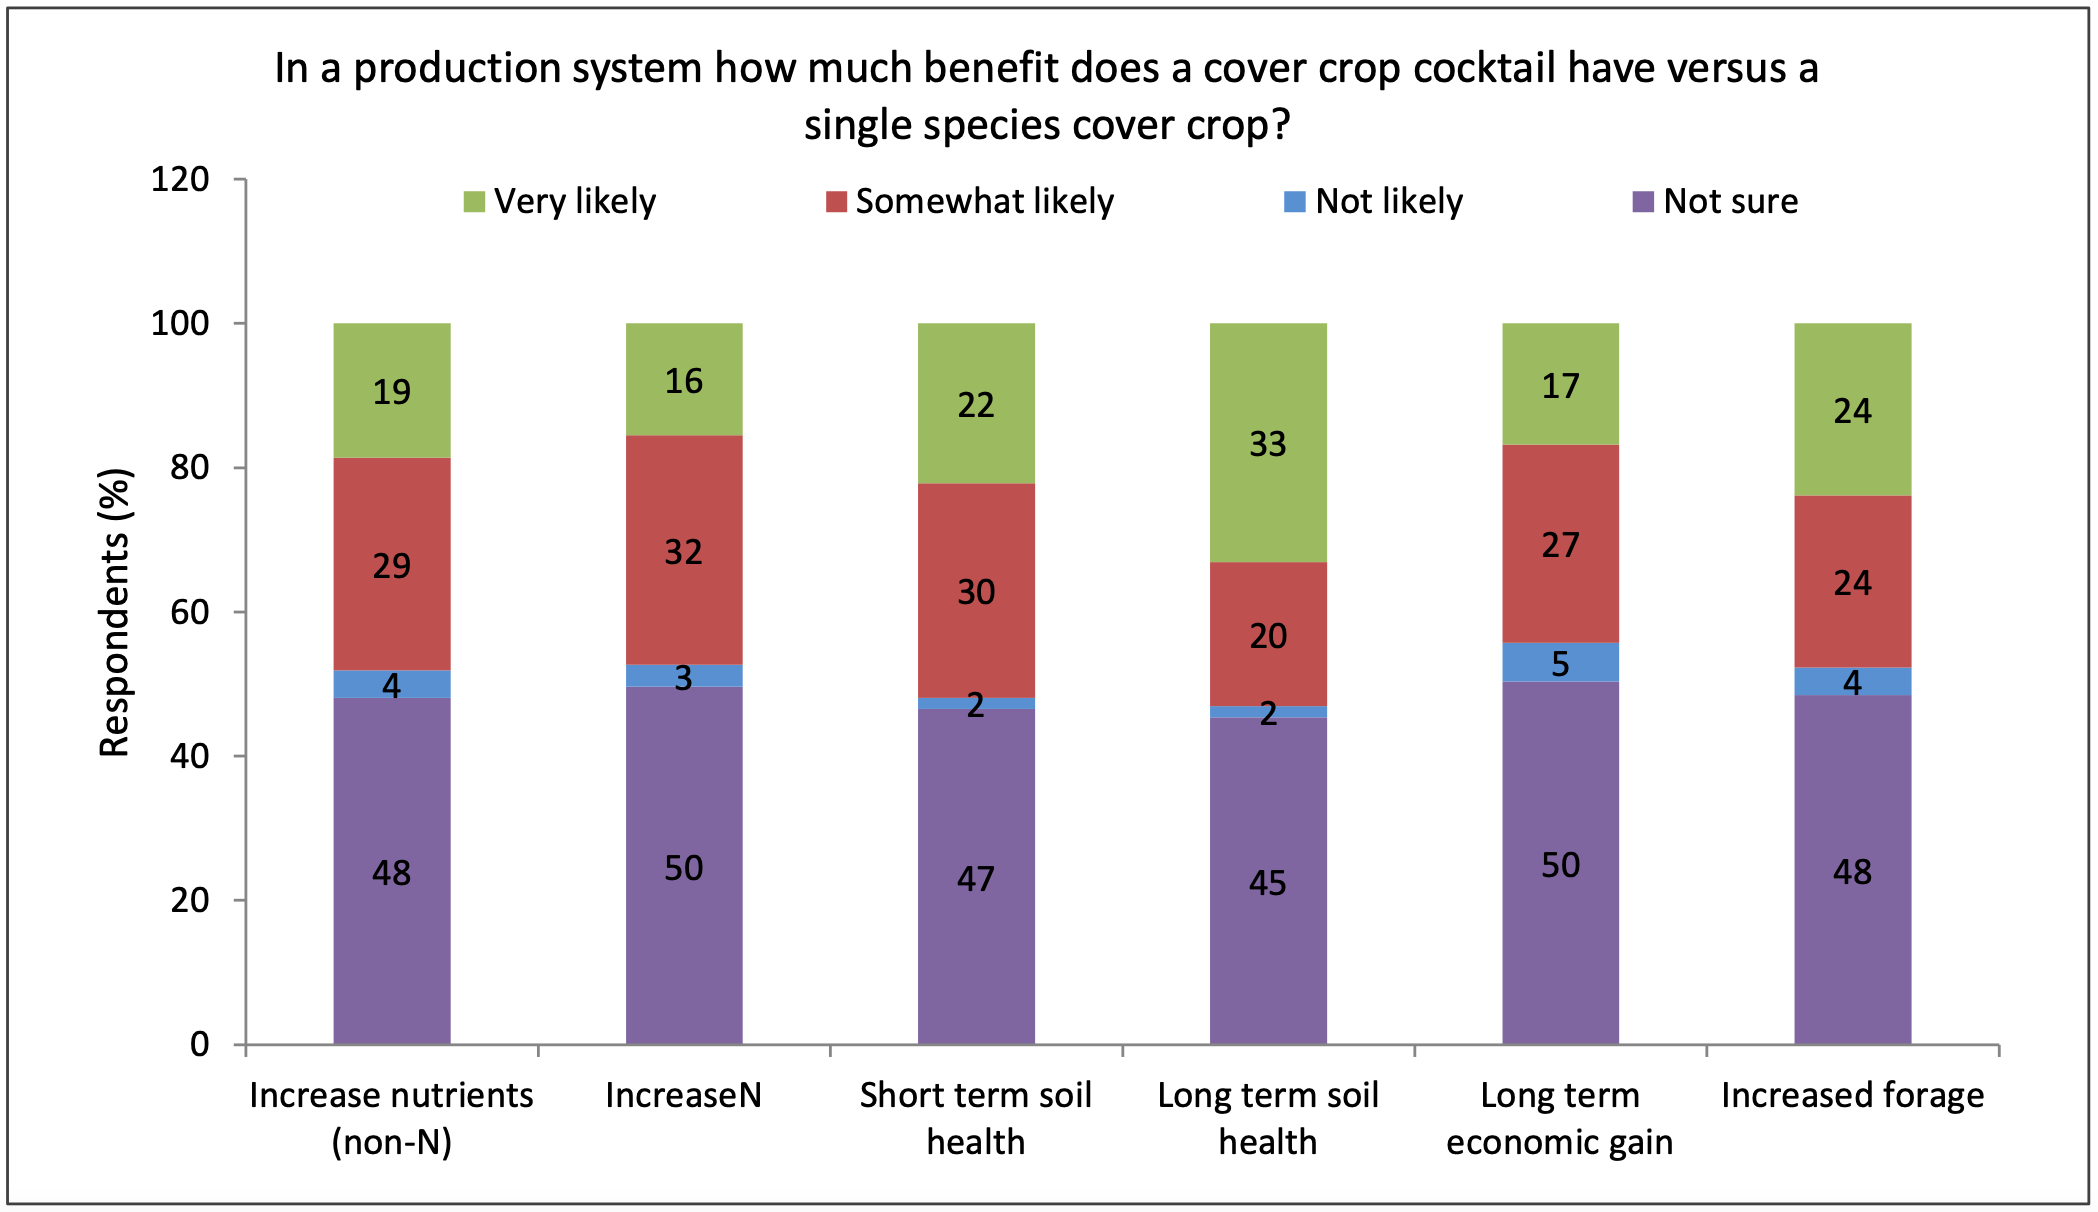 Figure 21.All respondents were asked to answer this question. N=133
While ecological studies have shown that biomass can increase with increasing number of species (Tilman 1996) and that part of the reason for that is increased use of soil resources by a diverse plant community (Mueller et al. 2013), we are unaware of any regional research that has found benefits to soil health from increased cover crop diversity. In wetter regions, increasing crop diversity through rotations has a positive effect on soil organic matter and soil fertility (Tiemann et al. 2015). In the current four-year WSARE- funded study, we have found essentially no differences in soil health parameters, such as microbial enzymes and compaction, after one year of growing either an 8-species mix versus a single species pea, but we see an increase in soil activity with increasing covercrop biomass. It is not known whether respondents have generally believed that increased diversity should be good for soil, or have been taught that more recently with an increased focus on cover crop diversity. Long-term research is needed to determine if mixtures are more beneficial to soil and net return than single species cover crops.
The cost of cover crops is definitely a consideration for producers. It is somewhat surprising that less than half of the respondents were aware that NRCS provides incentives for growing cover crops, despite all of the respondents being in FSA programs (Fig. 22).
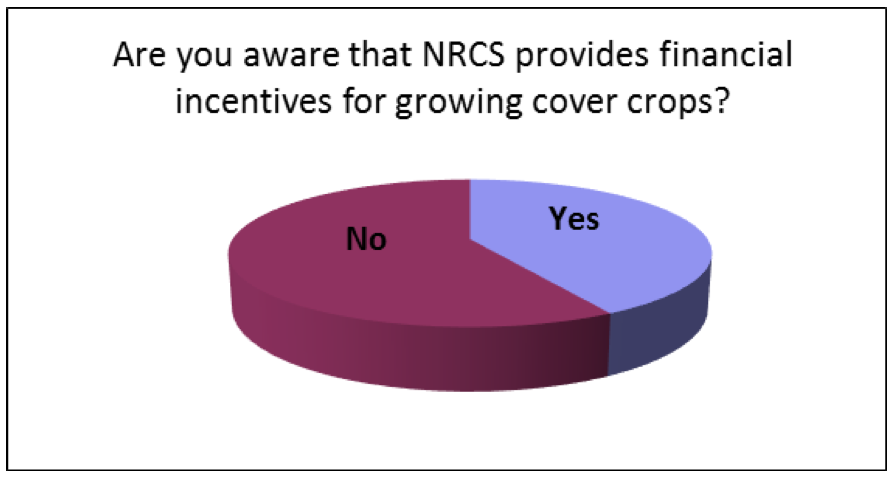
Figure 22.About 42% of all respondents were aware that NRCS provided financial incentives for cover crops. N=146
This likely reflects that ~30%of respondents did not have any land in cereals, and therefore likely wouldn'thave had a place in their rotation for cover crops.
Fewer than 30% of cover crop growers have received NRCS payments for growing cover crops (Fig. 23). It appears that most respondents who are growing cover crops are doing so for reasons other than economic incentives, in line with answers to other questions.
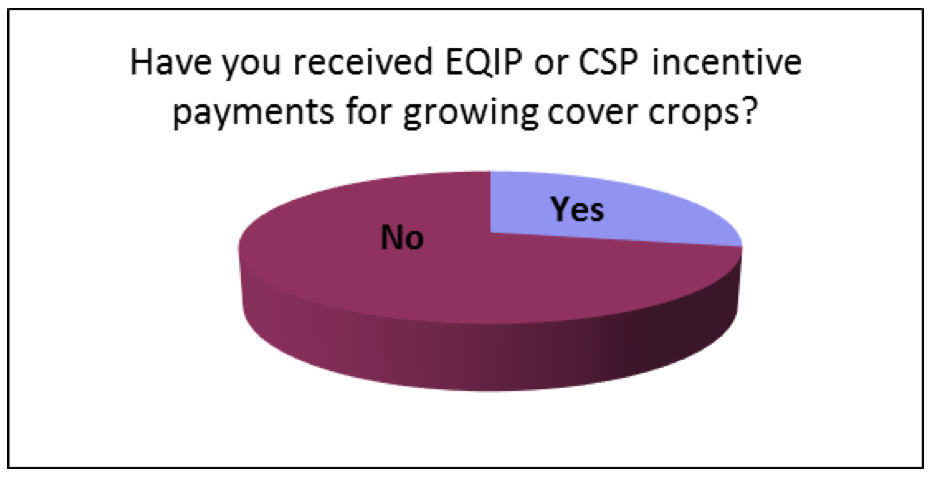 Figure 23.The vast majority (72%) of cover crop growers have not received NRCS incentive payments
for growing cover crops. N=46
Figure 23.The vast majority (72%) of cover crop growers have not received NRCS incentive payments
for growing cover crops. N=46
Future Direction
Respondents were asked what future questions they would like answered. The most frequently posed questions were from topics on forage mixes, economics, effects on other crops, soil benefits, and effects on water (Fig. 24). Some examples of the questions posed include:
-
What is the best crop to plant after cover crop?
-
Are some cover crops counterproductive to certain crops?
-
Can there be an expected increase in organic matter and at what rate?
-
Can cover crops replace chem-fallow in a 12’’ annual rainfall area?
-
What are the highest yielding, late season options- i.e., to follow an annual crop as a
double crop?
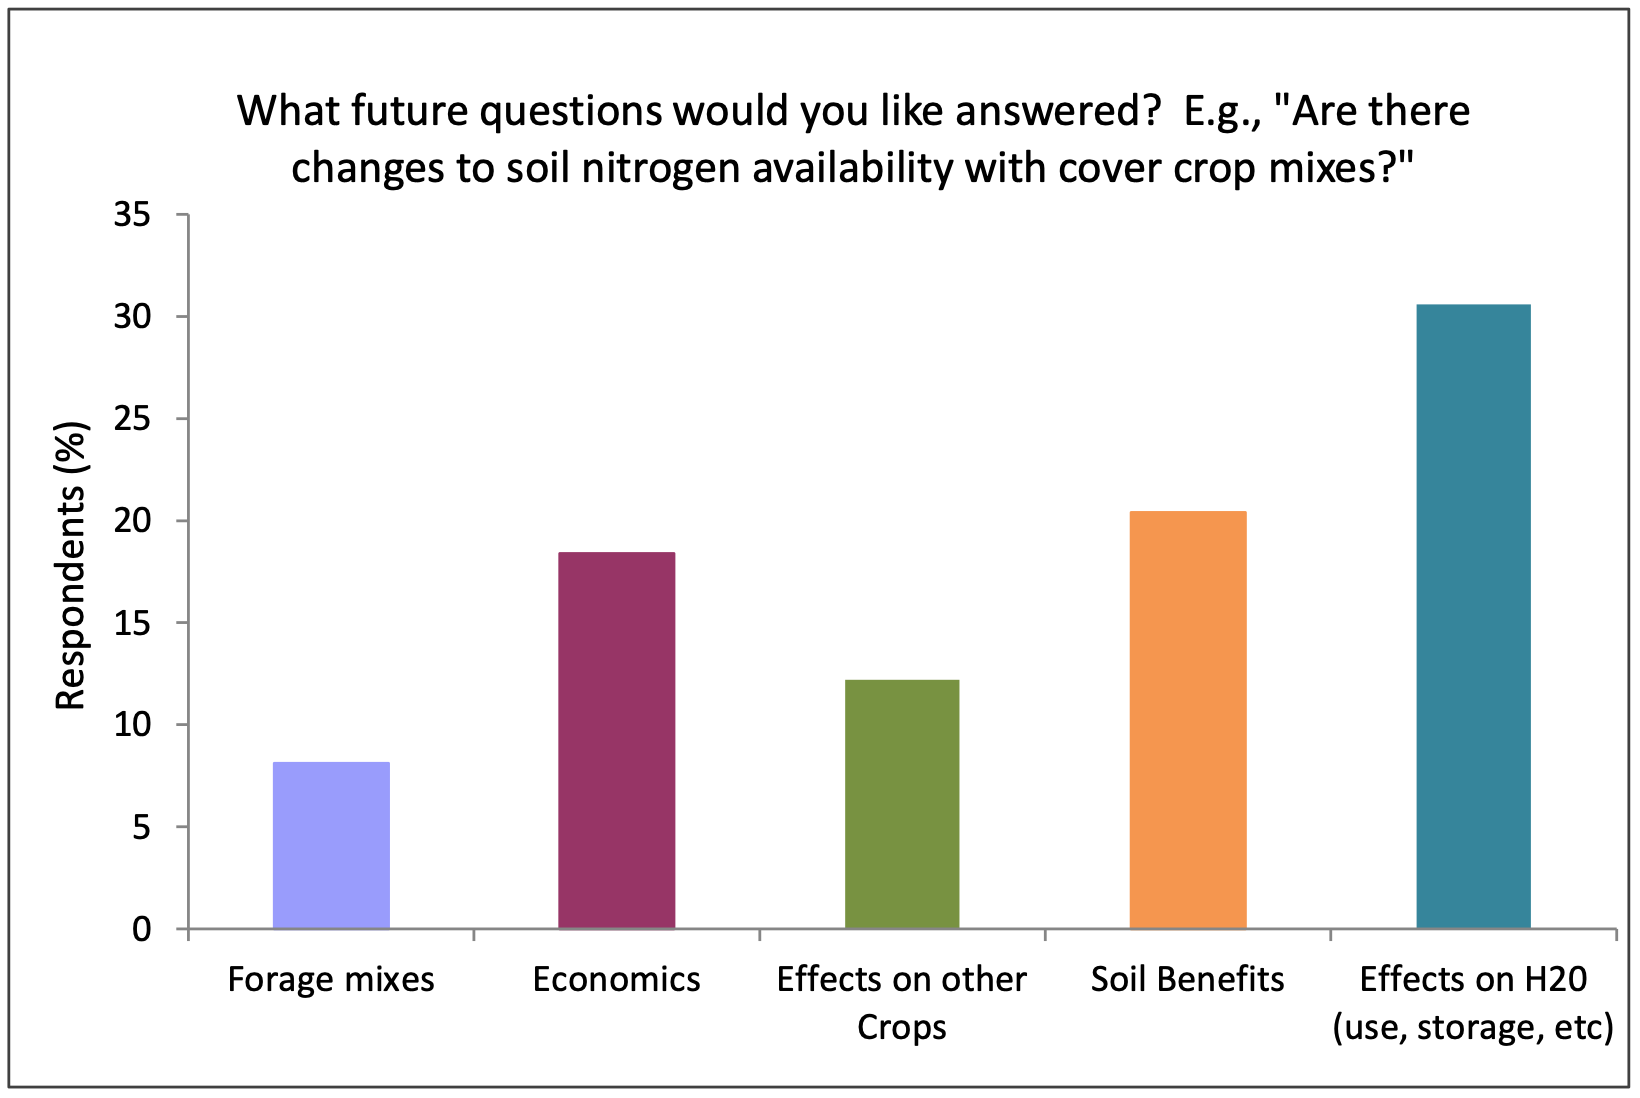 Figure 24.The whole respondent list was asked to answer this short answer question. “Economics” included cost/benefit and insurance. Other question topics listed by 5%
or fewer of the respondents include program incentives, infrastructure, pest management,
and basic knowledge. N=49
Figure 24.The whole respondent list was asked to answer this short answer question. “Economics” included cost/benefit and insurance. Other question topics listed by 5%
or fewer of the respondents include program incentives, infrastructure, pest management,
and basic knowledge. N=49
Some questions were not field research questions, but rather indicated the types of questions on the minds of growers. Common questions included:
-
Is there any special machinery required?
-
Is there cover crop insurance?
Summary
The survey found about 30% of respondents were growing cover crops and about 90% of those say they will continue to use them. Most respondents were relatively unfamiliar with cover crop mixtures. Soil health was consistently cited as the biggest reason to adopt cover crops, whereas water use, effect on next crop, and economics, were cited as biggest reasons to quit or not grow cover crops. Cover crop growers seem to be optimistic about the value of cover crops. Research, agency and Extension entities need to continue their efforts to provide information leading to cover crop success.
References
Burgess, M., P. Miller, C. Jones, and A. Bekkerman. 2014. Tillage of legume green manure affects dryland spring wheat yield. Agronomy Journal. 106:1497-1508. doi:10.2.134/agronj14.0007.
Miller, P., C. Jones, M. Burgess, R. Engel, and A. Bekkerman. 2015. Pea in rotation with wheat reduced uncertainty of economic returns in southwest Montana. Agronomy Journal. 107(2):541-550. doi:10.2134/agronj14.0185.
Mueller, K.E., D. Tilman, D.A. Fornara, and S.E. Hobbie. 2013. Root depth distribution and the diversity-productivity relationship in a long-term grassland experiment. Ecology. 94:787-793.
O’Dea, J.K., P.R. Miller, and C.A. Jones. 2013. Greening summer-fallow with no-till legume green manures in dryland wheat agroecosystems: An on-farm assessment in north- central Montana. Journal of Soil and Water Conservation. 68:270-282.
Tiemann, L.K., A.S. Grandy, E.E. Atkinson, E. Marin-Spiotta, and M.D. McDaniel. 2015. Crop rotational diversity enhances belowground communities and functions in an agroecosystem. Ecology Letters. 18:761-771.
Tilman, D., D. Wedin, and J. Knops. 1996. Productivity and sustainability influenced by biodiversity in grassland ecosystems. Nature. 379:718-720.