
Environmental and Management Effects on Pea Protein in Montana: A Research Report from the Montana Research and Economic Development Initiative
Michael Bestwick1, Kathrin Olson2, Clain Jones2, and Perry Miller2
1. Former MSU Research Associate; currently with Jackola Engineering and Architecture, Kalispell, MT, 2. Research Associate, Professor/Extension Soil Fertility Specialist, and Professor, respectively, Dept. Land Resources and Environmental Sciences, Montana State University, Bozeman.
Report Summary
This report is based on the final report of the Agriculture MREDI (Montana Research & Economic Development Initiative) Grant 41W212. The project objectives were to: a) determine standard management and environmental effects on yellow pea protein; and b) evaluate the precision of NIR (near infrared reflectance) analysis for yellow pea protein estimates, the primary commercial protein analysis method. To achieve our first objective, 82 pulse producers provided us with 149 independent yellow pea samples and associated management details from the 2013-2016 growing seasons. Observed standard practices for yellow pea include, 1) no-till seeding in cereal stubble in April, 2) use of rhizobia inoculant, and 3) use of nitrogen (N), phosphorus (P), potassium (K), and sulfur (S) starter fertilizers and pesticides. Protein concentration ranged from 19 to 30%, with a mean of 25% and 22-23% as the median range. The most important management factors for pea protein concentration observed in this study were rhizobia inoculant type (peat granular vs. peat-powder seed-coat) and S fertilizer management, though it is possible that the small sample size (149 samples) limited our detection ability for other management effects. There was higher seed protein in severe drought (24.5%) than wet (22.9%) environments; higher protein (by 1.6 units) when granular inoculant was used compared to peat-powder seed-coatings under severe drought conditions; and higher protein (0.8 units) under moderate drought conditions when S was used. The two most common yellow pea varieties (CDC Meadow and CDC Treasure) accounted for 52% of all samples collected, and protein was the same between these two varieties. The remaining 48% of samples came from more than 18 other pea varieties. Application of N, P, or K fertilizers did not have a detectable effect on yellow pea protein.
For our second objective, validating NIR estimates with protein measurements, we first assessed uncertainty in laboratory measurement of yellow pea protein. We tested how sample size (1, 2, or 3 tablespoons) affected differences in duplicated whole seed and flour measurements, using wheat as a control. We found a tendency for error in protein measurements to become smaller as sample size increased, especially using pea flour. Measurement error (i.e., differences between duplicate subsamples from the same pea sample) averaged 0.82 and 0.65% for whole seed and flour, respectively, compared to 0.29 and 0.28% in the wheat control. Protein measurement uncertainty was much greater in yellow pea than in wheat. At this time we recommend a minimum of 3 tablespoons of peas from a sample be ground prior to standard combustion analysis of pea protein.
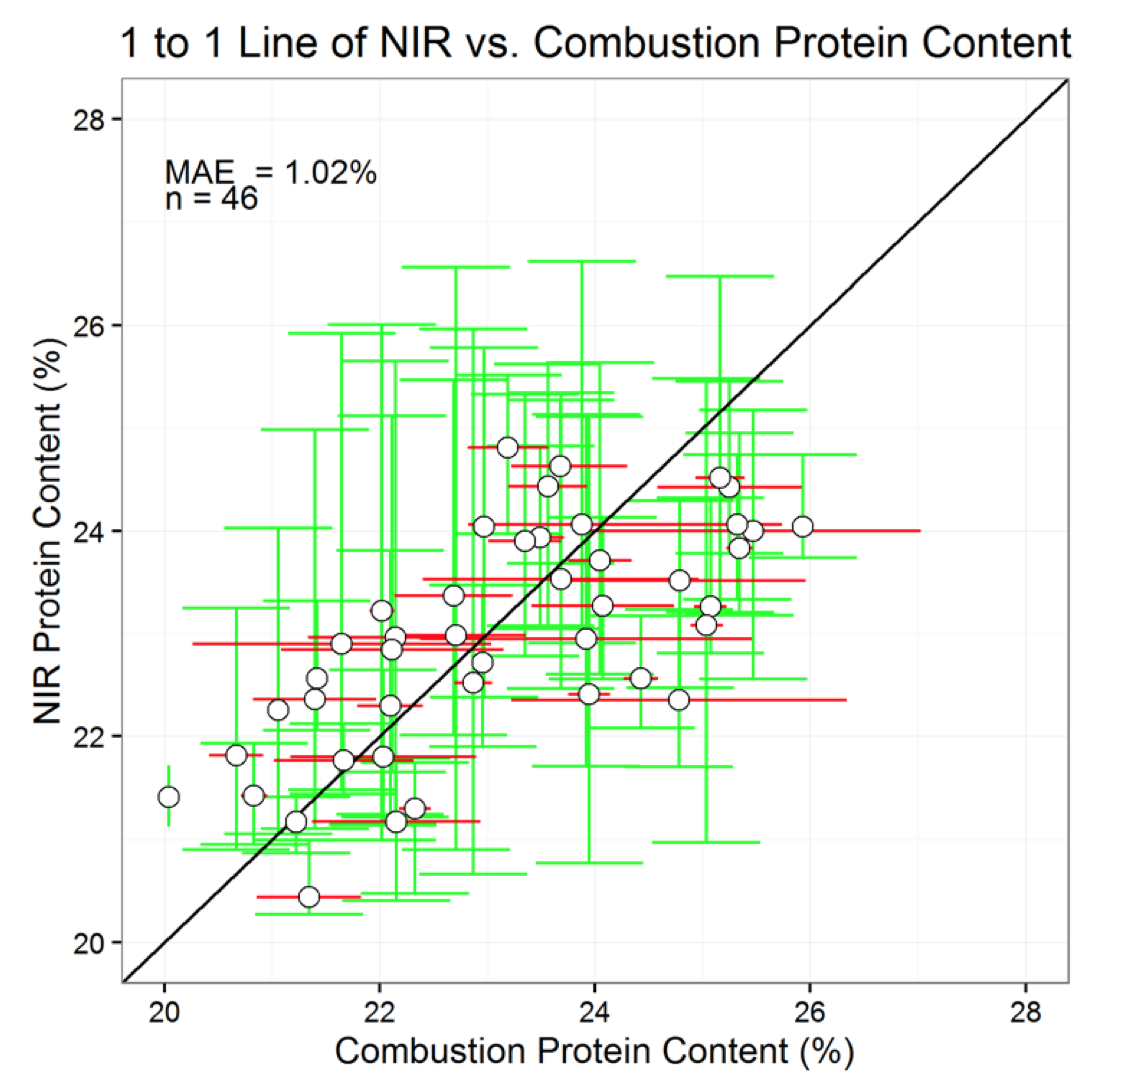
Finally 46 yellow pea samples previously measured using the combustion method were compared with protein estimates made on NIR. Measured and estimated protein content had an average absolute error of 1.02%. It may be difficult to achieve greater precision with NIR considering the high laboratory measurement uncertainty in yellow pea, reported above. The degree of precision in current commercial NIR instruments is not known, but may be even less precise than what we reported here.
Some companies who buy yellow pea in Montana for protein fractionation offer premiums as high as $1/bu for high protein pea, and would like to know how to encourage growers to produce high protein pea consistently. Our results should help guide future research to improve management and measurement of pea protein. Agronomic research into timing and amounts of N provision to yellow pea is needed to better understand pea protein formation. In order to validate NIR accuracy, more work should be focused at pinpointing sources of protein measurement uncertainty in yellow pea. A standard set of samples could be developed to test NIR estimate accuracy among instruments, if this is of interest to commercial entities who buy pea for protein fractionation.
Project Scope and Objectives
Consumer demand for ‘clean label’ (e.g., non-GMO, simple, minimally processed) plant-based protein is rising. This adds intrinsic domestic value for producers growing yellow pea in Montana through protein fractionation markets. Specifically, if Montana establishes itself as a source of yellow pea with consistently high protein, it is feasible that markets will target yellow pea grown in Montana via bid price and location of delivery facilities for protein fractionation. This will translate directly to greater revenues for the Montana agricultural sector.
Currently, little scientific information is available relating environment (e.g., soils and climate) and management (e.g., nutrient use, inoculation, variety, etc.) to yellow pea protein across Montana except by Tao et al. (2017). This project’s primary objective therefore was to identify standard management of yellow pea and identify if management variation was affecting yellow pea protein across Montana’s water-limited growing environments.
Further, if pea protein becomes an important marketing factor, it will be necessary to verify that traditional laboratory control methods for measuring yellow pea protein are in agreement with streamlined technologies used to measure pea protein on an industrial scale. This will ensure that both researchers and industry provide consistent yellow pea protein measurements to producers and consumers alike. Hence a secondary project objective was to assess uncertainty in protein measurements made by the control laboratory method, or combustion method (Abatzoglou, 2013) and verify that protein estimates made by the streamlined NIR method commonly used on an industrial scale agree with one another.
Primary Objective: Comparing the Effects of Standard Management and Drought Intensity on Yellow Pea Protein Content
Methods
In order to identify standard management of yellow pea and determine if management variation has an impact on yellow pea protein across Montana, two steps were taken. First, producers were contacted and asked to complete surveys as well as provide yellow pea samples from their farms. Second, yellow pea samples were tested for protein, and statistical analyses were performed to identify if the combination of management and environment (e.g., soils and climate) affected yellow pea protein. These steps are detailed below.
Establishing Producer Contact, Surveys, and Sample Collection
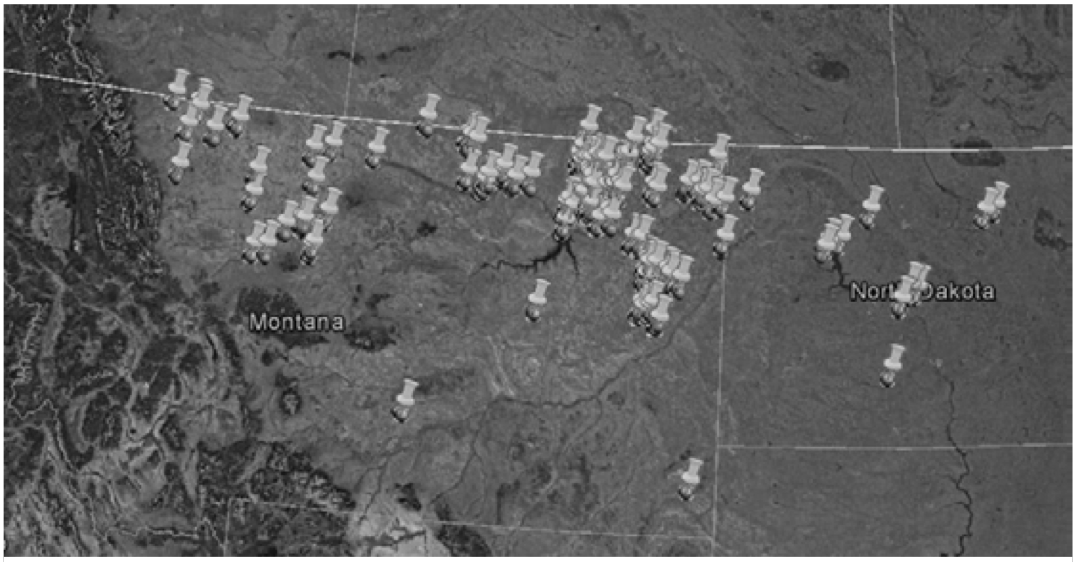
Obtaining yellow pea samples proved more challenging than we had hoped. We had envisioned working in concert with the Montana Department of Agriculture and a major pea buyer to efficiently source at least 500 pea samples. The MDA State Grain Lab was unable to supply any samples and the commercialpea buyer supplied fewer samples than anticipated. A major bottleneck was uncertainty about privacy requirements related to submitted grower samples, resulting in a time-consuming preliminary step of contacting each potential grower directly, reducing both the efficiency of sample collection and the ultimate sample number. A total of 149 pea samples were analyzed. Yellow pea producers were informed of the study via flyers, radio/web announcements, phone calls, extension agents, industry contacts, and direct pleas at pulse grower meetings and field days in Montana and North Dakota. Willing participants were asked to complete a short survey covering field legal location and management of their yellow pea along with a representative yellow pea field sample (~ a 1 qt. Ziploc Bag) for protein testing corresponding to each survey.
Yellow Pea Protein Testing and Statistical Analysis
Yellow pea samples were tested at MSU for protein using the combustion method (LECO). In short, yellow peas were ground into a fine flour, combusted in a crucible, and the amount of N gas detected from the combusted pea flour was used to calculate the percent protein in each ground sample. A standard conversion factor of 6.25 was used to convert from seed N to a ‘protein’ value.
The combustion method only requires a small volume of seeds to make a protein measurement, so in order to get a better estimate of the protein in the overall sample or bulk sample, protein was measured in duplicate. Specifically, 100 seeds were counted from bulk samples, split into 50-seed duplicates, ground into a fine flour, and each ground flour duplicate was tested for protein. Duplicated protein measurements were averaged to estimate the bulk sample protein.
Bulk pea protein measurements were linked to respective survey responses to look for correlations among growing season conditions, management, and protein. Seeding date and field location was used in conjunction with available climate data (Abatzoglou, 2013), soils information (Soil Survey Staff-NRCS, 2015), and pea growing degree day models (Miller et al., 2001) to simulate drought stress patterns over the crop cycle. Cluster analysis was used to group similar drought patterns into discrete drought environments, and select management variables were tested to assess how protein was affected across drought environment using ANOVA.
Results
General Protein Content and Standard Management
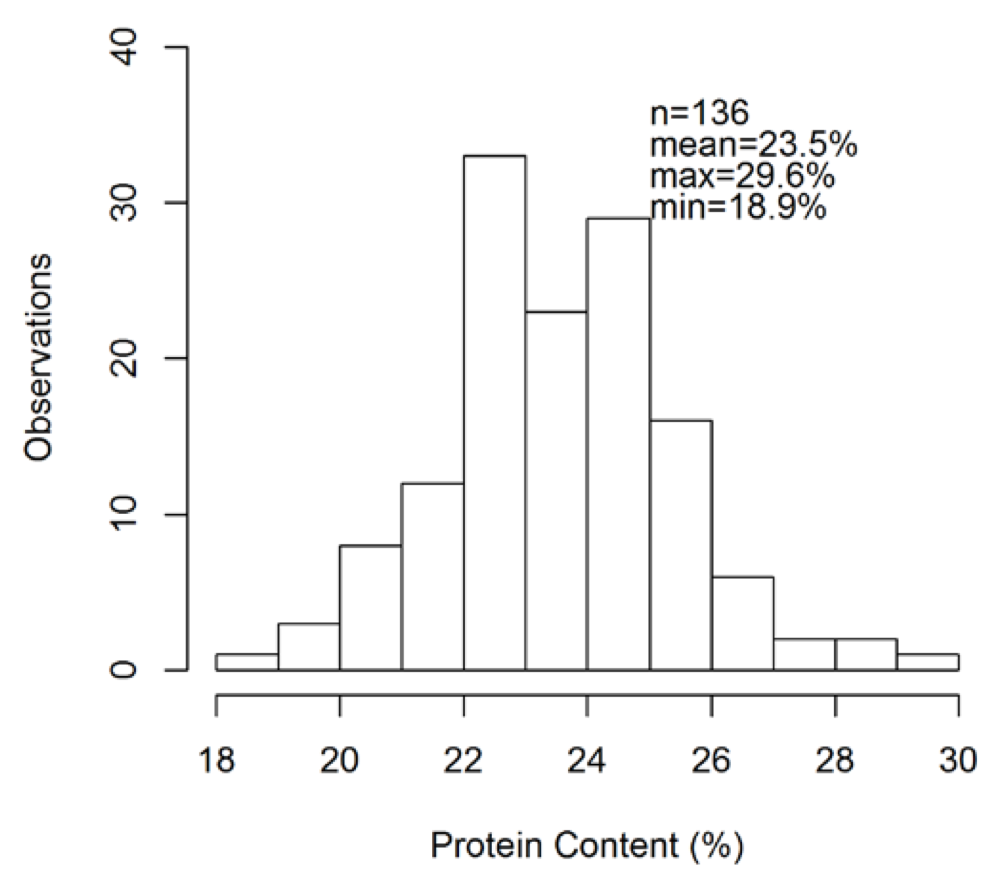
A total of 149 yellow pea samples were collected from 82 Montana and North Dakota farms spanning the 2013-2016 growing seasons (Fig. 1). The average protein content of these samples was 23.5%, but protein ranged from 18.9-29.6% (Fig. 2).The primary management variables that were similar across farms were as follows. Yellow pea is:
-
seeded in April
-
grown with conventional fertilizer and pesticide inputs
-
grown with no-till seeding
-
inoculated
-
seeded following a cereal - generally spring wheat, winter wheat, durum, or barley.
Management variables that were not similar across farms are as follows:
-
Variety selection varied both within and across farms. The two predominant varieties were CDC Meadow and CDC Treasure. These varieties constituted 28, and 23% of field samples respectively (though even higher percentages in northeast MT), while the remaining 48% were comprised of Delta (~10%) , AC Agassiz (~7%), Montech 4193 (~6%), Montech 4152 (~6%), Mellow, Korando, Spider, Nette, Salamanca, Trapeze, Bridger, CDC Golden, Capris, Early Star, Jet Set, Admiral, Prosper, Navarro, and unreported varieties (~29%) (n=149 total samples).
-
Farms were almost evenly split between using peat granular (45%) or peat-powder seed-coat (51%) inoculant. Three farms reported using liquid inoculant, and two farms did not specify if they used inoculant (n=82 separate farms).
-
Nutrient management varied across farms. Forty percent of farms did not use fertilizer on yellow pea and 60% used various blends and rates of N-P-K-S fertilizer. Of the 60% of farms that doapply fertilizer (n=49 separate farms that use fertilizer), the proportion that applied N-P-K and S were as follows.
-
N: 94%, reported rates vary from 2 to 11 lb/acre
-
P2O5: 98%, reported rates vary from 15 to 52 lb/acre
-
K2O: 18%, reported rates vary from 5-10 lb/acre
- S: 61%, reported rates vary from 3-8 lb/acre
-
Since the percent of farms applying P and N fertilizer were similar, and the amount of P applied by monoammonium phosphate (e.g., 11-52-0) would supply the rates of N reported, we believe N was probably only applied as a “by-product” of P, rather than a separate starter N.
Typical Environments for Yellow Pea Grown Across Montana
Individual drought stress patterns were simulated for each yellow pea sample (n=136; 149 total samples minus 13 samples with reported hail damage). Each line in Fig. 3A represents a simulated drought stress pattern. Drought intensity shown on the vertical axis is expressed as a ratio of 0 to 1 with a value of 0 indicating no drought stress and a value of 1 indicating extreme drought stress. Growing degree days (base temp = 0°C) determined from reported seeding dates and daily temperature data are shown on the horizontal axis. A more detailed description of the mechanics of the simulated drought patterns can be found in Bestwick (2016).
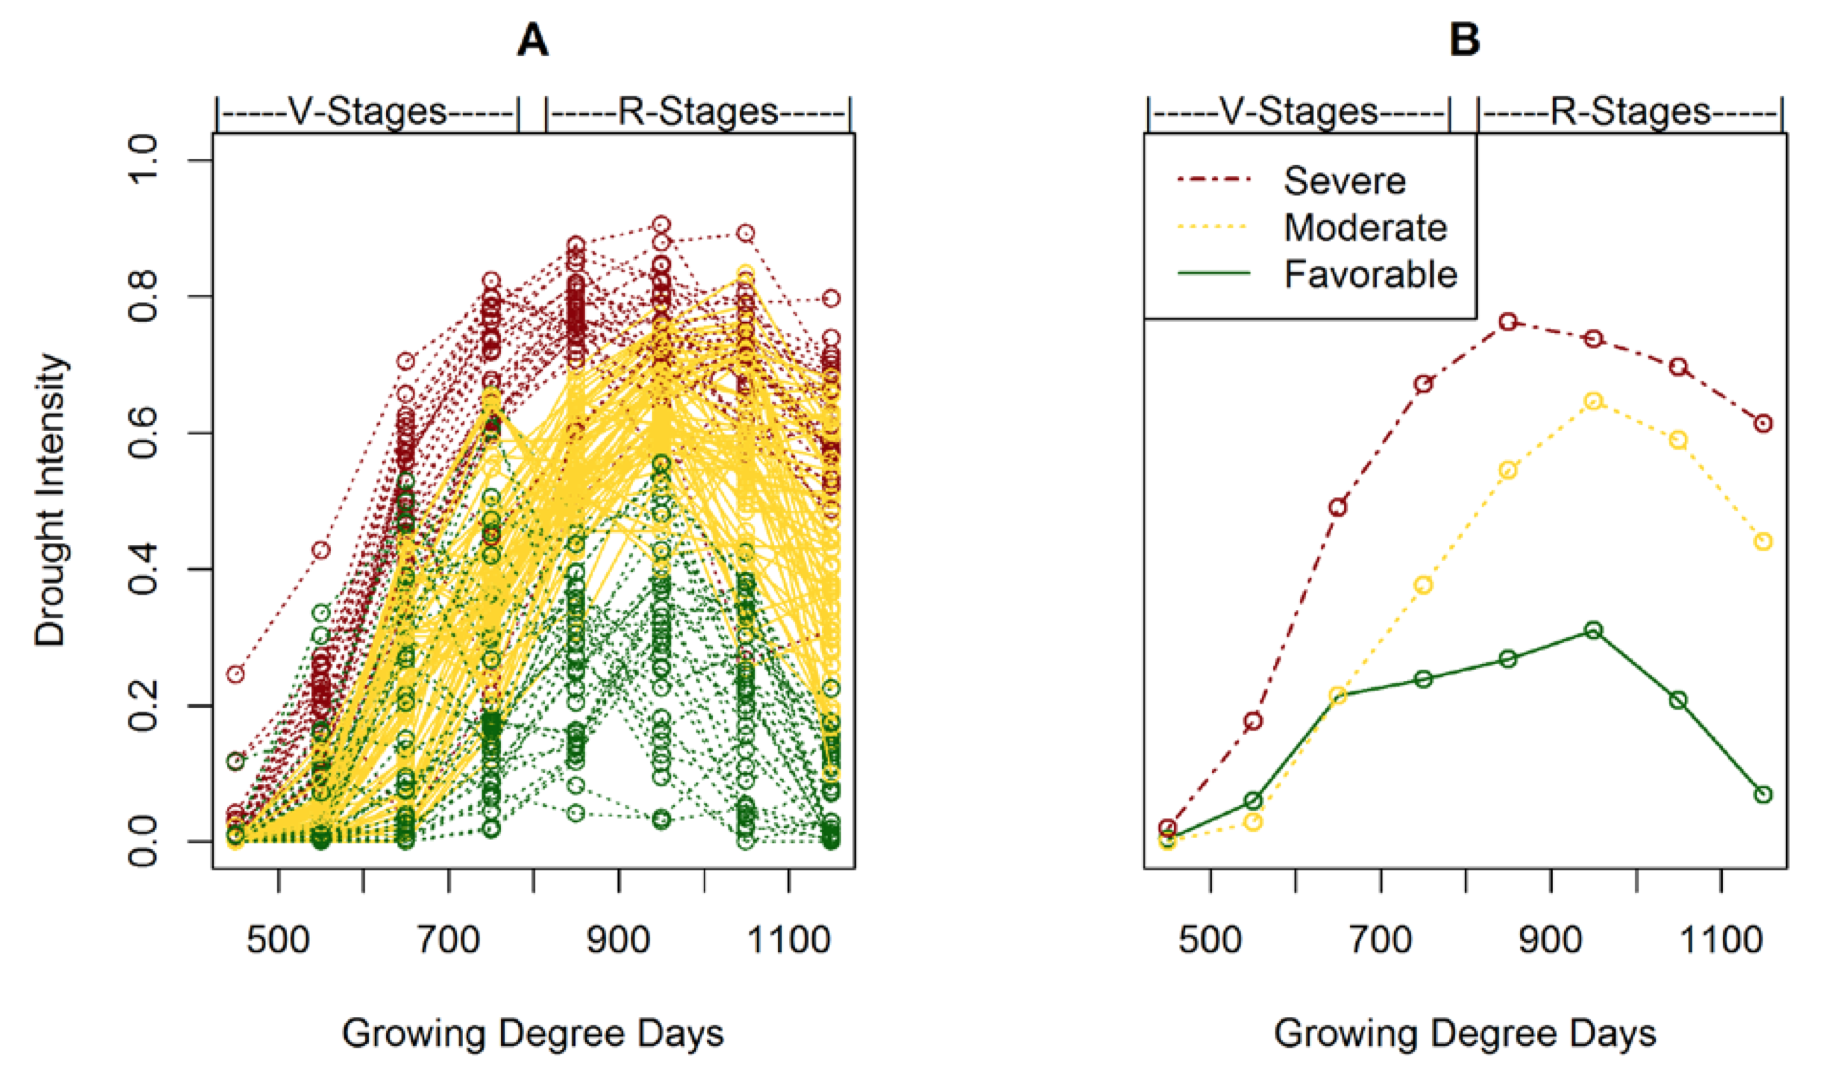
Figure 3. (A) Individual drought simulations, and (B) typical drought patterns derived from clustering techniques in both vegetative (V) stages and reproductive (R) stages.
Clustering techniques were applied to group simulated drought stress patterns into three drought environments (Fig. 3B). The three drought environment can be interpreted as favorable (green), moderate (yellow), and severe (red). In the low stress drought environment, pea did not undergo significant drought stress until after flowering. Low drought stress was due to timely precipitation, heavy soils, and moderate temperatures or any combination of environmental factors that provided the crop adequate soil water supply. Conversely, in the high drought stress environment, pea was subjected to drought stress beginning in the vegetative (V) growth stages, increasing in reproductive (R) growth stages (after flowering), and lasting to maturity. A high drought stress environment can result from low rainfall, hot temperatures, soils with low water holding capacity, or any combination of environmental factors that limit soil water supply.
Effects of Drought Intensity and Management on Pea Protein
Because variety selection, inoculant type, and application of fertilizer represented important management factors across farms (see General Protein and Standard Management), the effect of these variables on protein content was tested separately for each drought environments.
The specific effects of management by drought environment on pea protein were made as follows and results are presented in Table 1:
-
Inoculant type (peat granular vs. peat-powder seed-coating, hereafter called ‘granular’ and ‘seed- coat’) and drought environment.
-
Nutrient management and drought environment, with the following nutrient management comparisons:
-
P fertilizer vs. no P fertilizer
-
K fertilizer vs. no K fertilizer
-
S fertilizer vs. no S fertilizer
-
|
Table 1. Effects of Classified Drought Environments and Select Management Factors on Yellow Pea Protein Content. |
|||||
| Drought Environment | Management Factor | ||||
| Inoculation | |||||
| Granular | Peat | Env. Avg. | P-Values | ||
| Severe | 24.53 A | 22.95 B | 23.74 | Drought Environment | NS* |
| Moderate | 23.35 B | 23.96 AB | 23.65 | Inoculation | NS |
| Favorable | 23.15 B | 22.83 B | 23.04 | Drought Environment x Inoc. | P < 0.05 |
| Mgmt. Avg. | 23.54 | 23.49 | |||
| Variety | |||||
| Meadow | Treasure | Env. Avg. | P-Values | ||
| Severe | 24.36 | 24.33 | 24.35 A | Drought Environment | P < 0.1 |
| Moderate | 24.01 | 23.52 | 23.79 AB | Variety | NS |
| Favorable | 22.79 | 23.12 | 22.95 B | Drought Environment x Variety | NS |
| Mgmt. Avg. | 23.69 | 23.54 | |||
| Phosphorus (P) | |||||
| Applied P | No Applied P | Env. Avg. | P-Values | ||
| Severe | 23.36 | 24.56 | 23.84 | Drought Environment | NS |
| Moderate | 23.63 | 23.68 | 23.65 | Phosphorus (P) | NS |
| Favorable | 23.11 | 22.82 | 23.01 | Drought Environment x P | NS |
| Mgmt. Avg. | 23.42 | 23.70 | |||
| Potassium (K) | |||||
| Applied K | No Applied K | Env. Avg. | P-Values | ||
| Severe | 22.58 | 24.02 | 23.84 | Drought Environment | NS |
| Moderate | 23.91 | 23.62 | 23.65 | Potassium (K) | NS |
| Favorable | 23.08 | 23.01 | 23.01 | Drought Environment x K | NS |
| Mgmt. Avg. | 23.35 | 23.54 | |||
| Sulfur (S) | |||||
| Applied S | No Applied S | Env. Avg. | P-Values | ||
| Severe | 23.19 AB | 24.19 | 23.84 | Drought Environment | NS |
| Moderate | 24.14 A | 23.36 | 23.65 | Sulfur (S) | NS |
| Favorable | 23.06 B | 22.98 | 23.01 | Drought Environment x S | P < 0.1 |
| Mgmt. Avg. | 23.62 | 23.47 | |||
|
* NS = Not significant at the P < 0.1 level Different letters within the same groupings are statistically different at the P < 0.1 level by Least Square Means |
|||||
The highest protein content (24.4%) was associated with severe drought, the lowest protein content (22.9%) was associated with favorable soil moisture and the impact of drought environment was the same for both CDC Meadow and CDC Treasure. Tao et al. (2017) also found that environment was far more important than variety at driving protein differences, yet found a positive yield – protein relationshipsuggesting moisture increased both yield and protein, opposite of our findings. The timing of drought influences its impact on pea protein (Tao et al., 2017; Bestwick et al., 2018), although to a lesser extent than in wheat. Tao et al. (2017) did find differences in how protein in each of nine cultivars responded to growing environment.
We found that in severe drought, granular inoculant produced higher protein (24.5%) than seed-coat inoculant (22.9%). Peat granular inoculant has been reported to be superior to peat-powder seed-coatings in dry growing conditions (Clayton et al., 2004). Use of granular inoculant in a severe drought environment may have led to better N fixation and thereby greater protein compared to seed-coat inoculants.
Sulfur appeared to increase protein by about 0.8 units in moderately drought stressed environments. Greenhouse studies have shown that N fixation is increased in soils with adequate S (Zhao et. al., 1999), but at the time of writing we know of no regional field trials that address the impact of S on N fixation and protein content in pea. Considering that 51 of 149 surveys reported using S, further investigation to verify the effect of S on pea protein may be beneficial to Montana producers.
Phosphorus and K fertilization did not correlate with yellow pea protein. Studies throughout the Canadian prairies found that nutrient management can have significant effects on yield, but protein was often unaffected (McKenzie et al., 2001a, b).
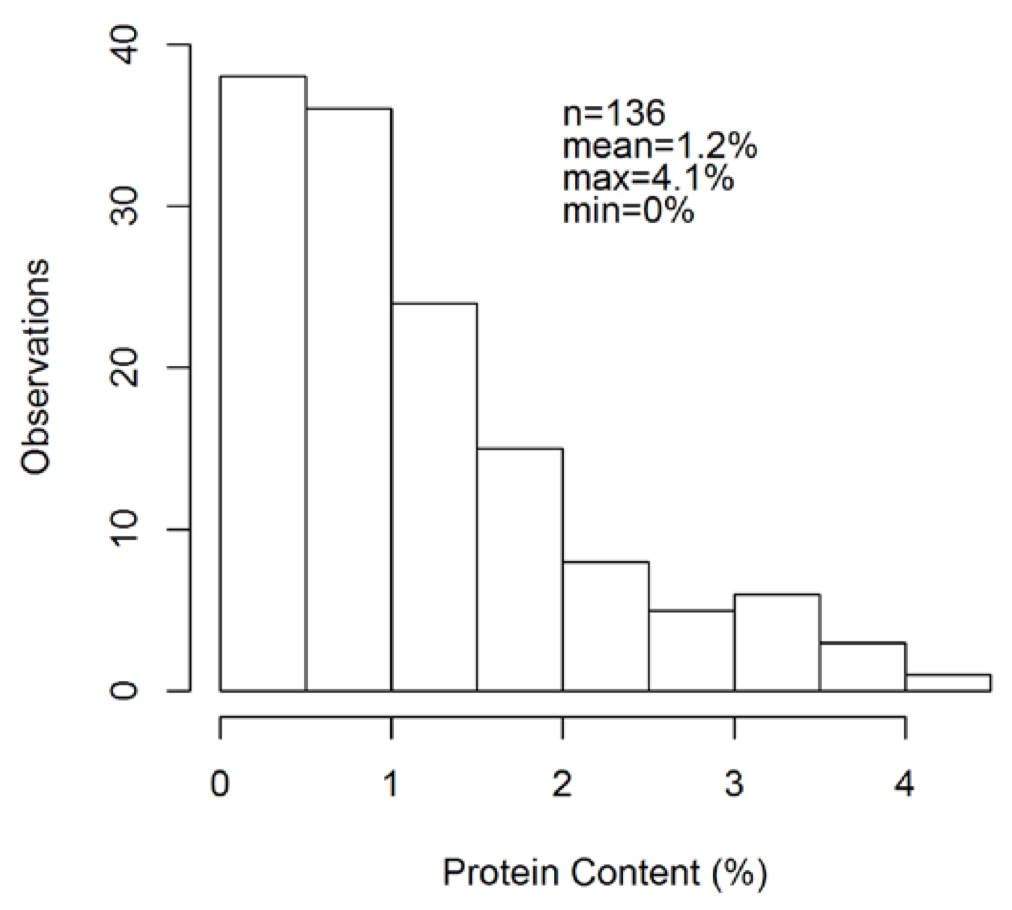
One reason why relatively few effects on pea protein by management or environment were found here may be due to uncertainty in yellow pea protein measurements. Of 136 yellow pea bulk samples measured in duplicate, the average difference in duplicate measurements for 50 seeds was 1.2 protein units (Fig. 4). This means that there is potential for large measurement uncertainty in yellow pea protein, so establishing statistical differences in management and environment may require triplicate or more subsamples per pea lot to get an accurate protein measurement.
Second Objective: Uncertainty in Yellow Pea Protein Measurements by the Standard Laboratory Method and Protein Estimates by NIR
Methods
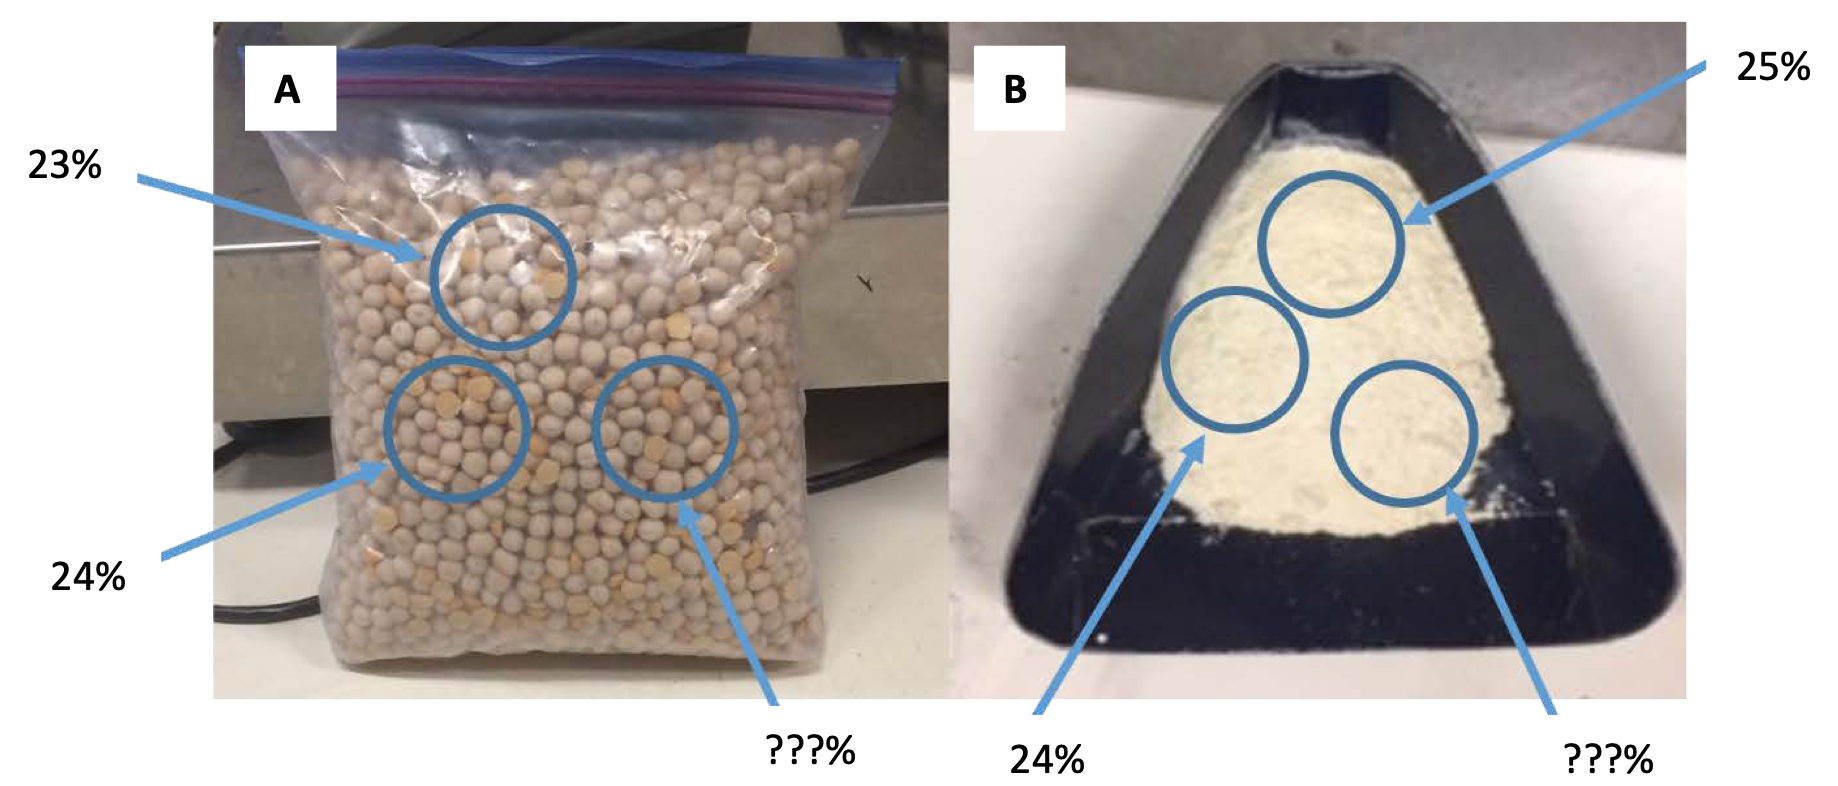
There are two primary sources of uncertainty associated with measuring protein using the standard combustion procedure; sampling different seeds from the bulk sample (Fig. 5A), and once seeds have been milled to flour for combustion analysis, sampling different portions of the ground sample (Fig. 5B). One factor that could affect these uncertainties is sample size. For instance, if a duplicate pair of fiftyseeds were sampled from the same bulk sample, their respective difference in protein may be larger than a duplicate pair of 100 seeds.
To determine the difference in measured protein between two subsampled pairs as affected by crop type and sample volume, four yellow pea and four spring wheat bulk samples were randomly taken from separate Montana farms. From each bulk sample, four subsample sizes of 1, 2, and 3 tablespoons were ground in a Udy mill with a 1-mm screen. Each subsample was tested for total N using combustion analysis in duplicate. Protein was determined by multiplying total N by 5.7 and 6.25 for wheat and pea, respectively. Spring wheat was included in the experiment to serve as a control to determine if there was similar protein measurement uncertainty within yellow pea as within spring wheat.
Validating Yellow Pea Protein Estimates with Near Infrared (NIR)
We randomly selected 46 of the 149 yellow pea samples provided to us. These were run on NIR (FOSS Infratec 1241), and the NIR protein estimates were compared against protein measurements made by the combustion method. The distance measure, or metric used to gauge the average difference between NIRestimates and combustion measurements, was the mean absolute error (MAE). A low value for the MAE indicates that estimated and measured protein are precise relative to one another, whereas as a high MAE indicates that estimated and measured protein do not agree with one another.
Results
Effect of Crop and Sample Size on Protein Measurement Uncertainty
Only crop had a significant effect on differences in protein measurements among duplicates (Table 2). The average difference in protein measurements for duplicated whole seed samples was 0.29 and 0.82 protein units for wheat and pea respectively. Similarly, the average difference for duplicate ground samples was 0.28 and 0.65 protein units for wheat and pea respectively (data not shown). These results suggest that there is greater protein measurement uncertainty in yellow pea than spring wheat.
|
Table 2. Effects of sample size (Tbsp) and crop type on measured protein unit differences among whole seed duplicates (4 subsamples of each of 4 samples per crop type run in duplicate). |
|||||
| Sample Size | Crop | ||||
| Wheat | Pea | Average | P-Values | ||
| One Tbsp. | 0.22 | 1.24 | 0.73 | Sample Size | NS |
| Two Tbsp. | 0.37 | 0.50 | 0.44 | Crop | P < 0.05 |
| Three Tbsp. | 0.26 | 0.71 | 0.49 | Sample Size x Crop | NS |
| Crop Avg. | 0.29 A | 0.82 B | Seed Lot (Crop)* | NS | |
| Sampel Size x Seed Lot (Crop)* | NS | ||||
| NS = No significant differences at the P < 0.05 level | |||||
| * Indicates random effect | |||||
| (Crop) nested within Crop | |||||
| Different letters within the same groupings are statistically different at the P < 0.05 level (Fisher LSD) | |||||
There was a tendency to see smaller differences among duplicated measurements with larger physical samples across crop type for both whole seed (Table 2) and ground samples (data not shown). However, our results from this small number of samples did not provide strong statistical evidence that increasing sample size would decrease protein measurement uncertainty. Based on these results we suggest using at least 2-Tbsp sized samples.
Uncertainty in yellow pea protein may arise from multiple sources. For instance, Ali-Khan and Youngs (1972) observed protein could range to ~ 9 protein units among different pea plants of the same variety. Likewise Atta et al. (2004) showed that protein could range by ~10 protein units depending on seed nodal position and variety. Variability in pea protein due to nodal location can be overcome with increased sample numbers per field. However, considering that the yellow pea samples for this analysis were taken from different Montana farms, its possible variety differences contributed to yellow pea protein uncertainty. Future studies could assess how both variety and nodal location affect uncertainty in yellow pea protein measurements.
Validation of NIR Estimates with Yellow Pea Protein Measurements
Estimated and measured yellow pea protein content determined by NIR and the combustion method agreed with one another with an average absolute error of 1.02% (Fig. 6). A MAE of 1.02% suggests that yellow pea protein estimates with NIR are not highly precise. Lack of precision is most likely due tonatural variation in yellow pea content as opposed to poor NIR calibration. Since duplicated protein measurements in pea whole seeds and flour averaged 0.82 and 0.65% (see above—Effect of Crop and Sample Size on Protein Measurement Uncertainty), it would be impossible to calibrate NIR with greater precision.
Based on these findings, more work could be focused on pinpointing the source of protein measurement uncertainty. For instance, if it could be determined that certain varieties demonstrate greater protein variability relative to others, then it may be worthwhile making variety-specific NIR calibration curves.Better understanding the sources of protein variability in yellow pea measurements could ultimately help ensure that both researchers and industry provide precise yellow pea protein measurements to producers and consumers alike.
References
Abatzoglou, J.T. 2013. Development of gridded surface meteorological data for ecological applications and modelling. Int. J. Climatol. 33(1): 121–131.
Ali-Khan, S.T., and C.G. Youngs. 1972. Variation in protein content of field peas. Can. J. Plant Sci. 53: 37–41.
Arganosa, G.C., T.D. Warkentin, V.J. Racz, S. Blade, C. Phillips, and H. Hsu. 2006. Prediction of crude protein content in field peas using near infrared reflectance spectroscopy. Can. J. Plant Sci. 86: 157–159.
Atta, S., S. Maltese, and R. Cousin. 2004. Protein content and dry weight of seeds from various pea genotypes. Agronomie 24: 257–266.
Bestwick, M.L. 2016. Water Stress in Montana Cropping Systems: Effects of Cultivar, Management, and Environment on Crop Production in Dryland Systems. M.S. Thesis. Mont. State Univ., Bozeman, MT. https://scholarworks.montana.edu/xmlui/handle/1/14317
Bestwick, M., P. Miller, C. Jones, and K. Olson-Rutz. 2018. Pea Protein Formation and Management Options.http://landresources.montana.edu/soilfertility/documents/PDF/reports/Bestwick2018PeaProt Formation.pdf
Clayton, G.W., W.A. Rice, N.Z. Lupwayi, A.M. Johnston, G.P. Lafond, C.A. Grant, and F. Walley. 2004. Inoculant formulation and fertilizer nitrogen effects on field pea: Nodulation, N2 fixation, and nitrogen partitioning. Can. J. Plant Sci. 84: 79–88.
McKenzie, R.H., A.B. Middleton, E.D. Solberg, J. DeMulder, N. Flore, G.W. Clayton, and E. Bremer. 2001a. Response of pea to rate and placement of triple superphosphate fertilizer in Alberta. Can. J. Plant Sci. 81(4): 645–649.
McKenzie, R.H., A.B. Middleton, E.D. Solberg, J. DeMulder, N. Flore, G.W. Clayton, and E. Bremer. 2001b. Response of pea to rhizobia inoculation and starter nitrogen in Alberta. Can. J. Plant Sci. 81: 637–643.
Miller, P.R., W. Lanier, and S. Brandt. 2001. Using Growing Degree Days to Predict Plant Stages. Montana St. Univ. Ext., Bozeman, MT. MT200103AGhttp://landresources.montana.edu/soilfertility/documents/PDF/pub/GDDPlantStagesMT200 103AG.pdf
Soil Survey Staff-NRCS. 2015. Web Soil Survey.http://websoilsurvey.nrcs.usda.gov/
Tao, A., R.K. Afshar, J. Huang, Y.A. Mohammed, M. Espe, and C. Chen. 2017. Variation in yield, starch, and protein of dry pea grown across Montana. Agron. J. 109: 1491-1501.
Tkachuk, R., F.D. Kuzina, and R.D. Reichert. 1987. Analysis of protein in ground and whole field peas by near-infrared reflectance. Cereal Chem. 64(6): 418–422.
Williams, P.C., K.H. Norris, and D.C. Sobering. 1985. Determination of Protein and Moisture in Wheat and Barley by Near-Infrared Transmission. J. Agric. Food Chem. 33: 239–244.
Williams, P.C., and D.C. Sobering. 1993. Comparison of commercial near infrared transmittance and reflectance instruments for analysis of whole grains and seeds. J. Near Infrared Spectrosc. 1: 25–32.
Zhao, F., A. Wood, and S. McGrath. 1999. Effects of sulphur nutrition on growth and nitrogen fixation of pea (Pisum sativum L.). Plant Soil 212: 209–219.