
Soil Nutrient Management for Canola
EB0224
Revised February 2024
By Clain Jones, Extension Soil Fertility Specialist and Professor and Kathrin Olson-Rutz, Research Associate
Department of Land Resources and Environmental Sciences
Montana State University
High canola yields depend on sound soil fertility management, proven agronomics, and cooperative weather. This bulletin presents the first item.
General Principles
Canola prefers soils with adequate infiltration and aeration. It is considered moderately
tolerant of salt and sodium, tolerating salinity up to 5 to 6 mmho/cm (millimho per
centimeter) before yields are reduced, similar to small grains. Canola performs well
between pH 5.5 and 8.5 (1). Minimal tillage and continuous high-diversity crop rotations
help keep the soil surface covered with crop residue and provide desirable soil conditions.
Maintaining soil fertility for optimal yields depends on selecting the right crop
rotations and providing fertilizer for optimal crop uptake with minimal nutrient loss
to the air, leaching, or run-off. Crop rotations help interrupt disease cycles and
influence nutrient demand of canola as well as the subsequent crop (Table 1). The
4Rs of right fertilizer source, right rate, right placement, and right timing for
a given production system reduce fertilizer loss and optimizes fertilizer uptake.
Table 1. Soil nutrient considerations for crop rotations that include canola.
| Soil Property | Consideration |
| Nitrogen (N) | Can be provided for canola by a legume, noting that alfalfa will deplete P for canola |
| Phosphorus (P) | Canola is a strong scavenger, depletes P for next crop |
| Potassium (K) | Canola leaves behind high K residue |
| Sulfur (S) | Canola is a strong scavenger, depletes S for next crop |
| Other | Reduced P, copper (Cu) and zinc (Zn) uptake by subsequent mycorrhizal dependent crops |
The 4Rs are usually interrelated; for example, the right rate, placement and timing are very dependent on the source. Getting it ‘right’ not only increases the farm’s bottom line but helps protect soil, water, and air resources as well. It all starts with determining the nutrient status of the soil.
Soil and Tissue Testing
Soil Testing
Soil tests are the basis for selecting optimum fertilizer application rates (see Interpretation of Soil Test Reports). Samples should be taken to 2 feet depth for nitrate and sulfate and to 6 inches for phosphorus (P), potassium (K), and micronutrients. In general, soil tests from samples taken in the spring rather than fall better reflect nitrogen (N) available to the crop that growing season because of overwinter N loss to leaching or gain through decomposition of organic matter.
Tissue Testing and Deficiency Symptoms
Even though plant tissue sufficiency levels are published for canola, there is too
much variability among cultivars, plant stages, and time of day that tissue is sampled
to make reliable nutrient management decisions based solely on tissue testing (2,
3).
Optical sensors, such as GreenSeeker, are a form of tissue testing for N management.
The optimum window for using N sensor technology to recommend top-dressed N fertilizer
is from approximately the 6-leaf stage (HB2.6) to the start of flowering (HB4.1; 4,
Saskatchewan). The technology can guide in-season N application in years with high
yield potential or direct N application to areas of a field with higher than average
yield potential, leading to more efficient use of N fertilizer. Unfortunately, growers
in Montana do not yet have access to regionally appropriate N fertilization suggestions
for given sensor readings in canola.
Plant symptoms can also be used to identify nutrient deficiencies (Table 2); yet, it is better to rely on soil test recommendations and/or nutrient removal
rates, because once nutrient deficiency symptoms appear, yield potential has likely
been reduced. Also, plants may be deficient because of environmental stress (e.g.,
cold, very wet soil) which cannot be improved with additional fertilizer, and plants
may recover once stress passes. Additionally, disease or herbicide damage may mimic
nutrient deficiency. See Plant Nutrient Functions and Deficiency and Toxicity Symptoms for more information.
Table 2. Canola nutrient deficiency and stress damage symptoms. Photos used with permission.
| NITROGEN: Bottom leaves yellow prematurely, plants are thin and spindly, with small leaves and few branches (5). |  |
| PHOSPHORUS: Older leaves show symptoms first, slow leaf expansion, smaller and fewer leaves,
dark green or bluish color, purple if severe. Plants are spindly with delayed maturity.
Deficiency symptoms appear by second week of growth. Found especially in cool or poorly aerated soils (IPNI/M. El Gharous). |
 |
| POTASSIUM: First visible in older leaves, the edges and areas between veins of older leaves
tend to turn pale green or yellow, followed by withering. The yellowing can occur
first in middle leaves if observed at bolting to flowering stages. K deficiency is rare in canola because canola is a good scavenger (IPNI/T. Roberts). |
 |
|
SULFUR: Yellowing of rapidly growing parts, especially reproductive structures. Young plants
have smaller and upward-cupped leaves. Severe deficiency symptoms show up about 2
weeks after germination. Medium |
 |
| BORON: Besides stunted growth of the main stem, leaves are deformed, curled, and rough skinned with torn leaf margins and necrotic lesions in interveinal space (IPNI/R. Norton; 2). |  |
| A. COLD DAMAGE: Leaf cupping B. HERBICIDE DAMAGE: Leaf cupping, chlorosis and purpling (1; Government of Western Australia). |
 |
Rate
Suggested fertilizer rates depend on the fertilizer source and placement, and are
presented under the individual nutrient sections below. If the fertilization goal
is to ‘maintain’ soil nutrient levels, crop removal rates can be used (Table 3). Because canola growth requires more nutrients than what is removed by harvest,
using removal rates will only maintain soil nutrient levels if no nutrients are lost
to erosion or leaching.
Table 3. Range of total pounds nutrient uptake and removed nutrient per bushel seed (N, P, K, S) by mature canola plants produced in the northern Great Plains.
| Macronutrient | S | K2O | P2O5 | N |
| Total Uptake (a,b) | 0.9 - 1.2 | 4.1 - 4.2 | 0.9 - 1.2 | 2.7 - 2.9 |
| In seed (a,b,c) | 0.2 - 0.4 | 0.5 - 0.6 | 0.7 - 1.2 | 1.5 - 1.9 |
| Micronutrient (d) | Boron | Chloride | Copper | Iron | Manganese | Zinc |
| Total uptake | 0.0057 | 0.02 | 0.0014 | 0.028 | 0.0028 | 0.0057 |
a: 6, Conrad, Montana b: 7, Canadian Prairies c: 8 d: 9

Balanced nutrition is important for optimizing yield and economic return of applied
fertilizer. Excess N promotes lodging, delayed maturity, foliar disease, and some
pests such as root maggots. Under-fertilizing limits yield and the crop’s ability
to compensate for pest damage.
Hybrid canola varieties have higher yield potential than open-pollinated traditional
varieties, (10, Alberta, Saskatchewan) and therefore require more available N (soil
N to 2 feet plus fertilizer N). However, P and K fertilizers are generally not needed
in larger amounts by hybrids because hybrids are especially good scavengers of these
and other nutrients, which has ramifications for fertilizer needs of the subsequent
crop (Table 1; 11, Manitoba; 12, Alberta).
Nitrogen
Nitrogen fertilization rates are usually based on yield potential and must consider
residual soil nitrate-N, organic matter contributions, and adjustments (credits or
debits) dependent on previous crop history. MSU fertilizer guidelines suggest optimal
total available N of 3.25 lb per bushel, however, this can vary greatly depending
on location and year (see Optimal N text box). Only a portion of this N ends up in the mature plant, and only two-thirds of that
gets removed from the field as seed (Table 3). High yielding varieties tend to yield more for each pound of available N, especially
at higher N rates, but ultimately need more N per acre to reach their production potential
(15, Saskatchewan)
Ideally, N rate is adjusted for the previous crop and different areas of a field.
In general, Montana soils provide 15 to 20 lb nitrate-N/acre for each percent soil
organic matter (SOM) above 2%. Fertilizer rates can be reduced by about 10 to 20 lb
N/acre (the ‘N credit’) following an annual legume in rotation, while the N-credit
from alfalfa is 40 lb N/acre. In contrast, if N is broadcast onto small grain stubble
in no-till, an additional 10 lb N/acre per 1,000 lb stubble (up to 40 lb N/acre) is
suggested for about 6 years in coarse soils and up to 15 years in fine-textured soils
(8; 16, Saskatchewan).
Canola is easily damaged by seed-placed fertilizer. Safe seed-placed fertilizer rates
depend on many factors (Table 4). Seed-placed N fertilizer rates need to be reduced if a P fertilizer that contains
N, such as monoammonium phosphate (MAP, 11-52-0), is seed-placed. For example, if
MAP is seed placed at 25 lb/acre, then the safe rate of N fertilizer needs to be reduced
by 2.75 lb N/acre. Use online safe rate calculators to get estimates for a given production
system (see Appendix).
Canola can only respond to N if sulfur (S) is not limiting. If S is deficient, adding
N (as well as P and K) decreases yield (Figure 1). Applying N:S in a 7:1 balance
can benefit yield if both N and S are deficient, however, the N:S ratio is irrelevant
if S is sufficient (19, Alberta, Saskatchewan, Manitoba). Sulfur is discussed later.

Figure 1. Canola yields decline with high N if S is deficient and high S helps most when N is sufficient (open-pollinated variety, N and S broadcast and incorporated just prior to seeding; 18, Saskatchewan).
Table 4. Safety of seed-placed fertilizer varies with relative soil conditions, opener width, row spacing, and fertilizer source.
| Risky | → | Safer | |
| Seed bed soil moisture | Dry | Borderline | Moist |
| Soil organic matter (a) | < 3.5% | 3.5 - 6% | > 6% |
| Soil texture | Sand | Loam | Clay |
| Soil pH | High | Medium | Low |
| Spreader opener (b) | 1" disc or knife | 2" spoon or hoe | 3" sweep |
| Row spacing | > 12" | 9" | 6" |
| N source |
Anhydrous ammonia (82-0-0) (c) |
Urea (46-0-0) UAN (28-0-0) |
Some specialty coated products |
| P or S source |
Diammonium phosphate (DAP, 18-46-0) |
Ammonium sulfate (21-0-0-24) |
Monoammonium phosphate (MAP, 11-52-0) |
a: 17
b: Check spread width under field conditions
c: Not recommended for seed-placed
Phosphorus and Potassium
Phosphorus and K rate guidelines are based on soil test levels (Tables 5 and 6), and do not vary with yield potential. Canola changes the soil chemistry around
its roots, enabling more P uptake from the soil than wheat (20). However, adequate
P in the first 2 to 6 weeks after germination is critical for high yield. Therefore,
10 to 15 lb P2O5/acre seed-placed P can be helpful even at soil P greater than 21
ppm, especially in cool or dry soil in which P is slow to move towards plant roots
(21, 22).
Safe rates of seed-placed P depend on the P source, opener, row spacing, and seed
bed conditions (Table 4). Use online calculators (see Appendix) to get estimated safe rates. Placement options for P rates higher than can be safely
seed- placed are presented in the Timing and Placement section.
Canola will only respond to K if there is sufficient N (23). Seed-placed K2O + N should not be higher than 10 lb/acre (8), or 4 lb/acre in sandy soils (24). This affects the ability to seed-place P, since MAP contains 2 lb N for every 10
lb P2O5. If 8 lb K2O/acre are seed-placed, then only 10 lb P2O5 as MAP can also be
seed-placed, and having P close to the seed is more important than having K close
to seed.
Table 5. Banded (a) P fertilizer guidelines for canola in Montana based on soil analysis (b).
| Olsen P Soil Test Level (ppm) | P2O5 (lb/acre) |
| 0 | 45 |
| 4 | 40 |
| 8 | 35 |
| 12 | 30 |
| 16 (c) | 25 |
a: Will need more if surface broadcast, especially at low P test levels.
b: 8
c: If soil test level is above 16 ppm then consider using removal rate (Table 3) or seed-place 10 lb P2O5/acre.
Table 6. Banded (a) K fertilizer guidelines for canola in Montana based on soil analysis (b).
| K Soil Test Level (ppm) | K2O (lb/acre) |
| 0 | 45 |
| 50 | 40 |
| 100 | 35 |
| 150 | 30 |
| 200 | 25 |
| 250 (c) | 20 |
a: Might need more if surface broadcast, especially at low K test levels.
b: 8
c: If soil test level is above 250 ppm then consider using removal rate (Table 3).
Sulfur and Micronutrients
There is no single accurate diagnostic tool for S or micronutrients. It is challenging
to get reliable soil S tests and there is little information on critical soil test
levels of micronutrients. Therefore, S and micronutrient fertilization rates are based
on a combination of field history, crop appearance, response to test strips, and tissue
and soil testing. Soils with less than 20 lb S/acre in the top 2 feet are most likely
S deficient (25).
Studies in Montana found 18 lb S/acre as sulfate was adequate for dryland canola when
broadcast at seeding (6). Because they are higher yielding, new hybrid varieties may
require 20 lb S/acre or more under S deficient conditions. Ammonium sulfate (21-0-0-24)
can be safely seed-placed at 9 lb S/acre when placed alone in loam soil, but the safe
rate is lower in dry, coarse soils or with the addition of MAP (26, Saskatchewan).
In-season S deficiency can be treated with up to 20 lb S/acre of ammonium thiosulfate
(12-0-0-26) or ammonium sulfate (27, North Dakota).
Micronutrients are taken up in very small amounts (Table 3). Deficiency symptoms may appear under cool, wet conditions, only to disappear as
the soil warms. Published critical soil and tissue test levels should be used only
as rough estimates of sufficiency. The risk of yield loss due to toxic effects from
excess micronutrient fertilization may be higher than any loss of yield due to deficiency.
Table 7 presents general guidelines for micronutrient fertilization. The best test for deficiency
is measuring the effect of fertilizer test strips on yield. Routine application is
not suggested. In over 100 comparisons from more than 60 site-years, there was no
benefit from boron fertilization (31, Canadian Prairies).
Table 7. General low soil levels (a) for micronutrients and application guidelines if nutrients are deficient (b).
| Nutrient | Low Soil Level (ppm) | Fertilizer Form | Timing | Rate | ||
| Broadcast & Incorporate | Seed-placed/side banded | Foliar | ||||
| Boron | NA (c) | Sodium Borate | Spring | 0.5 - 1.5 | NR (d) | 0.3 - 0.5 |
| Copper | < 0.4 | Sulfate | Spring or Fall | 3.5 - 5.0 | NR | NR |
| Oxysulfate | Fall | 2.0 - 5.0 | NR | NR | ||
| Chelated | Spring | 0.5 | 0.25 - 0.5 | 0.2 - 0.25 | ||
| Iron (e) | < 2.0 | Chelated | Spring | NR | NV (d) | 0.15 |
| Manganese | < 0.5 | Sulfate | Spring | 50-80 | 4 - 20 | NR |
| Chelated | Spring | NR | NR | 0.5 - 1 | ||
| Zinc | < 0.2 | Sulfate | Spring or Fall | 3.5 - 5 | NR | NR |
| Oxysulfate | Fall | 5 -10 | NR | NR | ||
| Chelated | Spring | 1 | NV | 0.3 - 0.4 | ||
a: 9
b: 2
c: NA – the commonly used hot water extractable B test is not an effective diagnostic
tool, 29
d: NR – not recommended, NV – not verified
e: 29
Source
The source of readily available nutrients, for example urea vs. urea-ammonium-nitrate
(UAN, 28-0-0 or 32-0-0) or MAP vs. diammonium phosphate (DAP, 18-46-0) often does
not substantially affect nutrient availability. Readily available nutrient sources
should be selected based on cost per pound of available nutrient, ease of application,
leaf burn potential, probability of germination issues if applied with the seed, and
reduced potential loss to volatilization (loss to the air) or leaching.
Polymer coating urea allows higher N rates to be applied in seed-rows (Figure 2) and is more effective than widening the seed-row band (32, Saskatchewan). However,
the reported safe rates of polymer coated urea (PCU) and the yield benefit are inconsistent
(13, Alberta, Saskatchewan) most likely because the rate at which N becomes available
from polymer coated urea depends on soil moisture, temperature, and texture, and how
prill handling has damaged the coating. Scaly equipment or systems operating at high
fan speeds can reduce safe rates of polymer coated urea (33). Polymer coated N release
is slow in cool, dry conditions, so blending polymer coated urea with safe rates of
non-coated urea may provide sufficient early N and higher safe seed-placed rates (14,
Alberta, Saskatchewan, Manitoba).
Polymer coated urea and urea treated with N-(n-butyl) thiophosphoric triamide (NBPT,
active ingredient of Agrotain®, N-Fixx, Arborite® AG, among others) volatilize less
than regular urea (see Enhanced Efficiency Fertilizers). Both NBPT-urea and SuperU® increased canola yields by approximately 5 bushels per
acre compared to urea, when fertilizer was broadcast or shallow banded (<1.5 inches)
in the western provinces (Figure 3).

Figure 2. Canola yield with seed-placed urea and polymer coated urea (PCU) at increasing N
rates in a wet seedbed environment (Scott, Saskatchewan) and dry seedbed environment
(Swift Current, Saskatchewan).
*PCU yields are greater than urea yields within the same environment with 95% confidence
(32).

Figure 3. Seed yield with urea, urea with NBPT, and SuperU (NBPT + nitrification inhibitor)
broadcast, shallow or deep banded (depths after packing). Yields with different letters
within N placements are different with 95% confidence (Dick, Nebo, Holzapfel and Tenuta,
unpublished data, courtesy 2, Alberta, Saskatchewan, Manitoba).
Trials with specialty P products have not consistently increased yields. However,
polymer coated P or liquid ammonium polyphosphate (10-34-0) can be safely seed-row
placed up to 35 lb P2O5/acre (34, Manitoba).
The main benefit of many specialized fertilizers is to allow application of higher
rates in the seed row, which simplifies application and saves time, but might not
increase yields. It is up to the producer to decide whether this is worth the extra
cost.
Some traditional nutrient sources are slow to dissolve into plant available forms.
For example, rock phosphate and elemental S generally do not provide enough phosphate
and sulfate, respectively, within the season. Rock phosphate requires 6 to 8 times
the amount to produce the same response as MAP or DAP (1). Elemental S does not provide sufficient S until 2 to 4 years after it is applied,
unless it is finely ground or suspended (which makes it highly corrosive) before application
(35, Saskatchewan; 36, Alberta, Saskatchewan). In contrast, ammonium sulfate and ammonium thiosulfate increase
yields the year of application as well as the following two crop years (37, Alberta, Saskatchewan, Manitoba).
Areas with high microbial activity or that have had earlier applications of elemental
S tend to convert elemental S to sulfate more rapidly (38, Alberta, Saskatchewan, Manitoba). However, repeated elemental S application can
decrease microbial biomass and soil enzymes (1). The addition of specialized bacteria that may increase nutrient availability has
not translated to increased yields (39, Alberta, Saskatchewan, Manitoba).
Canola is already a strong scavenger of P, K and S. Specialized amendments are a fast
evolving field, and strip trials and common sense are valuable when considering soil
amendments. If it sounds too good to be true, it probably is.
Legumes in rotation are a good N source for canola. They provide more soil N when
grown as green manure than for seed. However, short term overall net returns are greater
with pulse grain crops than with green manure in rotation, as long as water doesn’t
become limiting for the subsequent canola crop (40, Alberta, Saskatchewan, Manitoba). Canola yields are higher following alfalfa if
the alfalfa is terminated after the first cutting rather than after the second cutting
or in the spring, and by a combination of herbicide and tillage, rather than one or
the other (41, Saskatchewan). Fall planted alfalfa inter-seeded with winter wheat in Alberta provided
an extra 16 to 18 lb N/acre to the following canola crop (42, Alberta).
Animal manure can be an excellent source of many nutrients. It is especially high
in P and K, but contains variable nutrient amounts and should be tested for nutrient
content to calculate application rates. It may also contain herbicide residues.
Timing and Placement
Nutrients must be plant available before the period of rapid growth at stem elongation (Figure 4). Mobile nutrients such as N and S are best managed based on growing conditions and applied in early- to mid-spring. The less mobile nutrients P and K are best built up in the soil prior to seeding and applied with the seed in low, safe amounts to be near the emerging seedlings’ roots in the spring.

Figure 4. Canola dry matter and nutrient uptake over the growing season as a percent of maximum uptake (adapted from 22, Saskatchewan).
Fall application of N risks N volatilization loss if N is broadcast and left on the
surface, or leaching loss, especially in coarse textured soils and in areas with spring
flooding. Nitrogen is ideally applied as a split application, with 50 to 65% of the
suggested amount applied at seeding and the remainder to meet the current production
potential applied by the 5- to 6-leaf stage (43, Saskatchewan). The ability to withhold or reduce N applied in a second application
reduces the risk of wasted N and lost yield in case of drought. High N in drought
conditions reduces yield more than would be reduced by water limitation alone. High
initial N promotes large early growth which depletes soil moisture, leaving less for
seed fill.
Current N fertilizer placement options of side banding, pre-plant banding or early-spring
broadcasting with incorporation produce equal yields (44, Saskatchewan). However, urea must be banded at least 2 inches deep to minimize volatilization
loss (45, Quebec). Urea broadcast without incorporation or shallow banded (<1.5 inches) produced
approximately 4 bushels per acre less seed than urea banded 2 to 3 inches deep, presumably
because of volatilization differences (Figure 3). Side-row banding (2 inches from seed row) provides N more quickly than mid-row
banding (4.5 inches from seed row), but has lower safe rates (see N rate section;
46, Saskatchewan). Subsurface banding UAN increased yields by 5% over surface banded
UAN (47, Saskatchewan).
Phosphorus is best placed within the rooting zone. Seed-placed P is most effective
(48, Alberta), especially in areas with cool spring soils. Since canola generally requires
more P than is safe to place with seed, the remainder can be side banded at seeding,
pre-plant subsurface banded in the fall or spring, or come from soil P built up before
the canola rotation. Broadcast P is least efficient and generally not recommended
(49, Saskatchewan), particularly if not incorporated. Even with incorporation, broadcast
P requires 2 to 4 times the banded rates to get the same yield response (1). Nitrogen
and P can be banded together away from seed, and may help with P uptake as long as
N is less than 80 or 60 lb N/acre in 12- or 16-inch row spacing respectively (50). Higher N interferes with root growth into the band to access P (51, Alberta).
Potassium can be broadcast in the fall or winter before planting. If applied at seeding,
it should not be placed with the seed, rather it is best banded below and to the side
of the seed row. Broadcast incorporated K requires up to twice the rates as banded
applications for the same yield (23).
Adequate S should be available at emergence. Sulfate fertilizers are best seed-placed,
subsurface banded at or before seeding (38, Alberta, Saskatchewan, Manitoba), or broadcast and incorporated shortly before seeding
(Table 8). Sulfate broadcast even as early as emergence produces lower yields than if broadcast
at or before seeding (52, Saskatchewan). Rapid release elemental S (e.g., Vitasul®) broadcast in the fall
and incorporated pre-plant in the spring produces yields similar to sulfate spring
broadcast and incorporated pre-planting, but Vitasul® releases S too slowly to benefit
yield when applied in the spring (53, Saskatchewan). Elemental S provides no benefit if applied in the spring, and only
little benefit if broadcast in the fall and left on the surface to oxidize (35, Saskatchewan).
Table 8. Sulfur source and timing to benefit seed yield(a).
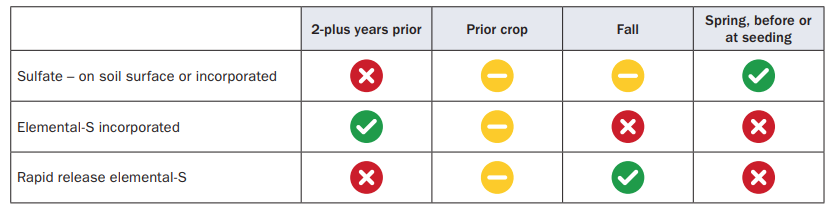
a: See text for references
NR: Not recommended
NI: Not ideal but may benefit yield
Rescue S treatments can be broadcast or foliar applied as sulfate up to early flowering
with moderate effectiveness; the earlier the better (52, Saskatchewan). However, foliar applications should wait until after the fifth leaf
emergence when leaves are sufficiently waxy to minimize potential leaf burn (27, North Dakota). Both surface and foliar rescue treatments rely on subsequent irrigation
or rain to move the S into the soil because little S is taken up through the leaf
(1).
The major challenge of micronutrient fertilization is adequate distribution of very
small amounts of fertilizer. Ideally, most micronutrients are best broadcast and incorporated
before seeding (Table 7). Banding and seed-row placement options are increasing as new products become available
that contain micronutrients within other prills such as MAP. Foliar applications can
provide micronutrients with even distribution, but generally not in sufficient amounts
to correct severe deficiencies (2).
Summary
Producers can’t control the weather, but they can develop a solid yield target and fertility plan. Nitrogen rates depend on yield potential, soil test results and adjustments for soil organic matter and legumes in prior rotations. Phosphorus and K rates are based on soil tests, while field history is important to determine S needs. The fertilizer source influences timing and placement. Sufficient nutrients must be available before early stem elongation. Sources such as granular or prilled elemental S release their nutrients too slowly to benefit canola if applied less than a couple of years before canola is grown. Readily available nutrients such as urea can be applied before or at seeding with additional amounts applied in-season to meet high yield potentials in good crop years. There are limits to amounts and types of fertilizers that can be safely seed-placed to minimize seedling damage. However, small amounts of seed-placed P and S can effectively help canola get a good healthy start. The right rate, source, timing, and placement of nutrients, along with the right rotations, are the basic foundation to optimize economic return of canola and protect soil, water and air resources. Creating check strips and recording results is useful to guide future management decisions. Based on extensive field trials, when the basic best management practices are followed and the weather cooperates, little else matters for a good canola crop. (54, Canadian Prairies).
Appendix
- Safe seed-placed fertilizer rate calculator:
- ‘Extension Publications’ at www.landresources.montana.edu/soilfertility, or by contacting MSU Extension Communications at 406-994-3273 or online at https://extension-store.montana.edu
Acknowledgements
We appreciate the time and expertise of the following for review and production of this bulletin:
- Dale Flikkema, Producer, Bozeman, Montana Rigas Karamanos, formerly Koch Agronomic Services, Calgary, Alberta
- Ronald Beneda, CHS Inc., Adams, North Dakota
- Shelley Mills, Valley County Extension Agent, Glasgow, Montana
- MSU Extension Communications
References
- Canola Council of Canada. 2016. Canola Encyclopedia. www.canolacouncil.org/canola-encyclopedia/
- Karamanos, R.E. Personal communication. Senior Agronomist. Koch Agronomic Services. Calgary, Alberta.
- Arnall, D.B., and A. Sutradhar. 2014. Canola Tissue Nutrient Concentrations as Affected by Temporal Variability. ASA, CSSA, & SSSA international annual meeting poster. Nov 2-5. Long Beach, California.
- Holzapfel, C.B., G.P. Lafond, S.A. Brandt, P.R. Bullock, R.B. Irvine, D.C. James, M.J. Morrison and W.E. May. 2009. Optical sensors have potential for determining nitrogen fertilizer topdressing requirements of canola in Saskatchewan. Canadian Journal of Plant Science. 89:411-425. doi:10.4141/CJPS08127
- Grains Research and Development Corporation. 2009. Canola Guide: Canola best practice management guide for south-eastern Australia. [Eds] Don McCaffery, Trent Potter, Steve Marcroft, and Felicity Pritchard. The Canola Council of Australia. 92 p. https://grdc.com.au/__data/assets/pdf_file/0016/202615/grdccanolaguide.pdf
- Jackson, G. 2000. Effects of nitrogen and sulfur on canola yield and nutrient uptake. Agronomy Journal. 92:644-649. doi:10.2134/agronj2000.924644x
- Johnston, A.M., S.S. Malhi, J. Schoenau and S. Exner. 1999. Biomass accumulation and nutrient uptake by annual crops. Research project report to the Canadian Fertilizer Institute, Ottawa, Ontario.
- Jacobsen, J., G. Jackson and C. Jones. 2005. Fertilizer Guidelines for Montana Crops. Montana State University Extension, Bozeman, Montana. EB0161. 25 p. https://extension-store.montana.edu/products/fertilizer-guidelines-for-montana-crops
- McKenzie, R.H. 2016. Developing Micronutrient Recommendations. Top Crop Manager. Mid-March. p. 12-15.
- Smith, E.G., B.H. Upadhyay, M.L. Favret and R.E. Karamanos. 2010. Fertilizer response for hybrid and open-pollinated canola and economic optimal nutrient levels. Canadian Journal of Plant Science. 90:305-310. doi:10.4141/CJPS09027
- Riekman, M.R. 2005. The effect of canola cultivar on water uptake and nitrogen and sulphur uptake. M.Sc. thesis, University of Manitoba, Winnipeg, Manitoba, Canada. https://mspace.lib.umanitoba.ca/items/5dfa2294-e32c-4c64-ae30-8e092f5023ec
- Karamanos, R.E., T.B. Goh and D.P. Poisson. 2005. Nitrogen, phosphorus, and sulfur fertility of hybrid canola. Journal of Plant Nutrition. 28:1145-1161. doi:10.1081/PLN-200063138
- Blackshaw, R.E., X. Hao, R.N. Brandt, G.W. Clayton, K.N. Harker, J.T. O’Donovan, E.N. Johnson and C.L. Vera. 2011. Canola response to ESN and urea in a four-year no-till cropping system. Agronomy Journal. 103:92-99. doi:10.2134/agronj2010.0299
- Harker, K.N., J.T. O’Donovan, T.K. Turkington, R.E. Blackshaw, N.Z. Lupwayi, E.G. Smith, H. Klein-Gebbinck, L.M. Dosdall, L.M. Hall, C.J. Willenborg, H.R. Kutcher, S.S. Malhi, C.L. Vera, Y. Gan, G.P. Lafond, W.E. May, C.A. Grant and D.L. McLaren. 2012. High-yield no-till canola production on the Canadian prairies. Canadian Journal of Plant Science.92:221-233. doi:10.4141/cjps2011-125
- Brandt, S.A., S.S. Malhi, D. Ulrich, G.P. Lafond, H.R. Kutcher and A.M. Johnston. 2007. Seeding rate, fertilizer level and disease management effects on hybrid versus open pollinated canola (Brassica napus L.). Canadian Journal of Plant Science. 87:255–266. doi:10.4141/P05-223
- McConkey, B.G., D. Curtin, C.A. Campbell, S.S. Brandt and F. Selles. 2002. Crop and soil nitrogen status of tilled and no-tillage systems in semiarid regions of Saskatchewan. Canadian Journal of Soil Science. 82:489-498. doi:10.4141/S01-036
- Karamanos, R.E., J.T. Harapiak and N.A. Flore. 2008. Revisiting seedrow nitrogen placement with wheat and barley. Canadian Journal of Plant Science. 88:1073-1086. doi:10.4141/CJPS08085
- Malhi, S.S., and K.S. Gill. 2007. Interactive effects of N and S fertilizers on canola yield and seed quality on S-deficient Gray Luvisol soils in northeastern Saskatchewan. Canadian Journal of Plant Science. 87:211–222. doi:10.4141/P05-218
- Karamanos, R.E., T.B. Goh and D.N. Flaten. 2007. Nitrogen and sulphur fertilizer management for growing canola on sulphur sufficient soils. Canadian Journal of Plant Science. 87:201-210. doi:10.4141/P06-133
- McKenzie, R.H., J.F. Dormaar, G.B. Schaalje and J.W.B. Stewart. 1995. Chemical and biochemical changes in the rhizospheres of wheat and canola. Canadian Journal of Soil Science. 75:439-447. doi:10.4141/cjss95-064
- Jackson, G. 1999. Canola Nutrient Management. Fertilizer Fact No. 22. Montana State University Extension, Bozeman, Montana. https://landresources.montana.edu/fertilizerfacts/
- Karamanos, R.E. 2013. Nutrient uptake and metabolism in crops. Prairie Soils & Crops Journal. 6:52-63.
- Grant, C.A., and L.D. Bailey. 1993. Fertility management in canola production. Canadian Journal of Plant Science. 73:651-670. doi:10.4141/cjps93-
- McKenzie, R.H. 2014. Determining safe rates of seed-placed fertilizer. Top Crop Manager. November. p. 62-66. www.topcropmanager.com/determining-safe-rates-of-seed-placed-fertilizer-16268/
- McKenzie, R.H. 2016. Developing Sulphur Recommendations. Top Crop Manager. March. p. 38-39. www.topcropmanager.com/developing-sulphur-recommendations-18727/
- Qian, P., R. Urton, J.J. Schoenau, T. King, C. Fatteicher and C. Grant. 2012. Effect of seed-placed ammonium sulfate and monoammonium phosphate on germination, emergence and early plant biomass production of brassicae oilseed crops. In: Oilseeds. U.G. Akpan [Ed]. p. 53-62, Rijeka: Intech Publishing Inc.
- Franzen, D.W., and J. Lukach. 2013. Fertilizing Canola and Mustard. North Dakota State University Factsheet SF1122. 8 p. www.ndsu.edu/agriculture/extension/publications/fertilizing-canola-and-mustard
- Karamanos, R.E. 2000. Micronutrients – update 2000. Proceedings of the Soils and Crops 2000 Workshop. pp. 334-352. February 24-25. Extension Division, University of Saskatchewan, Saskatoon, Saskatchewan.
- Karamanos, R.E., T.B. Goh and T.A. Stonehouse. 2003. Canola response to boron in Canadian prairie soils. Canadian Journal of Plant Science. 83:249–259. doi:10.4141/P02-095
- Gerwig, J., and R. Gelderman. 2005. Fertilizer Recommendation Guide. South Dakota State University Cooperative Extension Service. EC750. https://extension.sdstate.edu/sites/default/files/2023-06/P-00039-2023-v2.pdf
- Barker, B. 2016. Ultimate Canola Challenge 3.0. Top Crop Manager. April 2016. www.topcropmanager.com/fertilizer/pinpointing-the-effects-of-fertilizer-19068
- Malhi, S.S., E. Oliver, G. Meyerle, G. Kruger and K.S. Gill. 2003. Improving effectiveness of seedrow-placed urea with urease inhibitor and polymer coating for durum wheat and canola. Communications in Soil Science and Plant Analysis. 34:1709-1727. doi:10.1081/CSS-120021307
- Qin, S., F.C. Stevenson, R.H. McKenzie and B.L. Beres. 2014. Seed safety limits for cereals and canola using seed-placed ESN urea fertilizer. Agronomy Journal. 106:369-378. doi:10.2134/agronj2013.0357
- Grant, C., J. Relf-Eckstein and R. Zhou. 2013. Impact of traditional and enhanced efficiency phosphorus fertilizers on canola emergence, yield, maturity and quality. Canola Digest Science. Science Edition. p.17.
- Malhi, S.S. 2005. Influence of four successive annual applications of elemental S and sulphate-S fertilizers on yield, S uptake and seed quality of canola. Canadian Journal of Plant Science. 85:777-792. doi:10.4141/P04-133
- Malhi, S. S., E.D. Solberg and M. Nyborg. 2005. Influence of formulation of elemental S fertilizer on yield, quality and S uptake of canola seed. Canadian Journal of Plant Science. 85:793–802. doi:10.4141/P04-134
- Grant, C.A., A.M. Johnston and G.W. Clayton. 2004. Sulphur fertilizer and tillage management of canola and wheat in western Canada. Canadian Journal of Plant Science. 84:453-462. doi:10.4141/P02-083
- Grant, C.A., G.W. Clayton and A.M. Johnston. 2003. Sulphur fertilizer and tillage effects on canola seed quality in the Black soil zone of western Canada. Canadian Journal of Plant Science. 83:745-758. doi:10.4141/P02-107
- Karamanos, R.E, N.A. Flore and J.T. Harapiak. 2010. Re-visiting use of Penicillium bilaii with phosphorus fertilization of hard red spring wheat. Canadian Journal of Plant Science. 90:265-277. doi:10.4141/CJPS09123
- Khakbazan, M., C.A. Grant, J. Huang, E.G. Smith, J.T. O’Donovan, R.E. Blackshaw, K.N. Harker, G.P. Lafond, E.N. Johnson, Y.G. Gan, W.E. May, T.K. Turkington and N.Z. Lupwayi. 2014. Economic effects of preceding crops and nitrogen application on canola and subsequent barley. Agronomy Journal. 106:2055–2066. doi:10.2134/agronj14.0253
- Malhi, S.S., A.M. Johnston, H. Loeppky, C.L. Vera, H.J. Beckie and P.M.S. Bandara. 2007. Immediate effects of time and method of alfalfa termination on soil mineral nitrogen, moisture, weed control, and seed yield, quality, and nitrogen uptake. Journal of Plant Nutrition. 30:1059-1081. doi:10.1080/01904160701394501
- Blackshaw, R.E., L.J. Molnar and J.R. Moyer. 2010. Suitability of legume cover crop-winter wheat intercrops on the semiarid Canadian prairies. Canadian Journal of Plant Science. 90:479-488. doi:10.4141/CJPS10006
- Lafond, G.P., S.A. Brandt, B. Irvine, W.E. May and C.B. Holzapfel. 2008. Reducing the risks of in-crop nitrogen fertilizer applications in spring wheat and canola. Canadian Journal of Plant Science. 88:907-919. doi:10.4141/CJPS07169
- Johnston A.M., E.N. Johnson, K.J. Kirkland and F.C. Stevenson. 2002. Nitrogen fertilizer placement for fall and spring seeded Brassica napus canola. Canadian Journal of Plant Science. 82: 15–20. doi:10.4141/P01-038
- Rochette, P., J.D. MacDonald, D.A. Angers, M.H. Chantigny, M. Gasser and N. Bertrand. 2009. Banding of urea increased ammonia volatilization in a dry acidic soil. Journal of Environmental Quality. 38:1383-1390. doi:10.2134/jeq2008.0295
- Thavarajah, D., J.J. Schoenau , J.R. Bettany , G. Hultgreen , P. Qian , S.S. Malhi and R. Lemke. 2003. Early supplies of available nitrogen to seed‐row of a canola crop as affected by fertilizer placement. Journal of Plant Nutrition. 26:683-690. doi:10.1081PLN-120017675
- Holzapfel, C.B., G.P. Lafond, S.A. Brandt, W.E. May and A.M. Johnston. 2007. In-soil banded versus post-seeding liquid nitrogen applications on no-till spring wheat and canola. Canadian Journal of Plant Science. 87:223-232. doi:10.4141/P05-224
- Karamanos, R.E., J.T. Harapiak and N.A. Flore. 2002. Fall and early spring seeding of canola (Brassica napus L.) using different methods of seeding and phosphorus placement. Canadian Journal of Plant Science. 82:21-26. doi:10.4141/P01-095
- Bailey, L.D., and C.A. Grant. 1990. Fertilizer placement studies on calcareous and non‐calcareous chernozemic soils: Growth, P‐uptake, oil content and yield of Canadian rape. Communications in Soil Science and Plant Analysis. 21:2089-2104. doi:10.1080/00103629009368361
- Flore, N. Personal communication. Manager of Agronomic Services. Crop Production Services, Inc. Calgary, Alberta.
- Harapiak, J.T., and N.A. Flore. 1986. Nitrogen interference with P uptake from dual N-P bands. Proceedings. Great Plains Soil Fertility Workshop. February 21-22, 1986. Denver, Colorado.
- Nuttall, W.F., and H. Ukrainetz. 1991. The effect of time of S application on yield andsulphur uptake of canola. Communications in Soil Science and Plant Analysis. 22:269-281. doi:10.1080/00103629109368414
- Malhi, S.S., C.L. Vera and S.A. Brandt. 2014. Feasibility of a new granular rapid release elemental S fertilizer in preventing S deficiency of canola on a S-deficient soil. Agricultural Sciences. 5:1025-1036. doi:10.4236/as.2014.511111
- Barker, B. 2015. The Ultimate Canola Challenge: Take care of best management practices and little else matters. Top Crop Manager. March 2015. www.topcropmanager.com/corn/the-ultimate-canola-challenge-16918