
Soil Acidification: Problems, Causes & Testing
Posted August 2020
Most agricultural soils in Montana are near-neutral to basic with surface soil pH 6.5 to 8. However, fields with crop losses due to soil acidification have been found in 24 Montana counties. The decrease of soil pH in the seeding zone can be relatively rapid. Idaho agricultural soils went from neutral pH to pH less than 6 in about 25 years. The Soil Scoop Soil Acidification: Management presents management options. More information is available on our Soil Acidification website, and specifically about soil pH in Soil pH and Soil Organic Matter.
Soil pH
Soil pH is a measure of the soil solution’s acidity and determined by the concentration of H+ ions; as the concentration of H+ ions increases, pH decreases. The pH scale is from 0 to 14; acidic soils have low pH (<7), basic soils have high pH (>7), and pH 7 is neutral. Each pH unit change represents a 10-fold change in acidity. For example, a soil with pH 6 is 10 times more acidic than a soil with pH 7, and 100 times more acidic than pH 8.
Agronomic concerns of low soil pH
- Aluminum (Al), H+, and manganese (Mn) toxicity lead to yellow or purple foliage and poor growth. Aluminum toxicity creates plants with club or broom shaped roots (Figure 1). See the Nutrient Deficiency/Toxicity website for more images.
- Reduced rhizobial growth on legumes (e.g., pea, alfalfa) at pH < 6 severly limits nodulation/N fixation.
- Increased fungal diseases (e.g., Rhizoctonia, Fusarium, Cephalosporium stripe)
- Changes in herbicide/pesticide effectiveness and residual (e.g., Group 2, B herbicides, imidazolinones, triazolinones, atrazine)
- Plants are hungry due to low soil levels of all nutrients except metals (Figure 2).
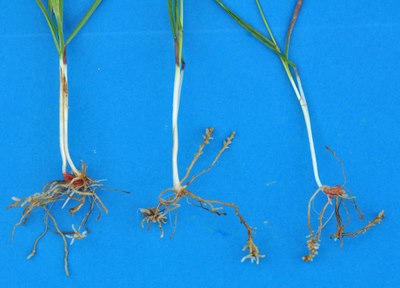
Fig. 1. Club roots of durum wheat from Al toxicity. Photo courtesy Rick Engel
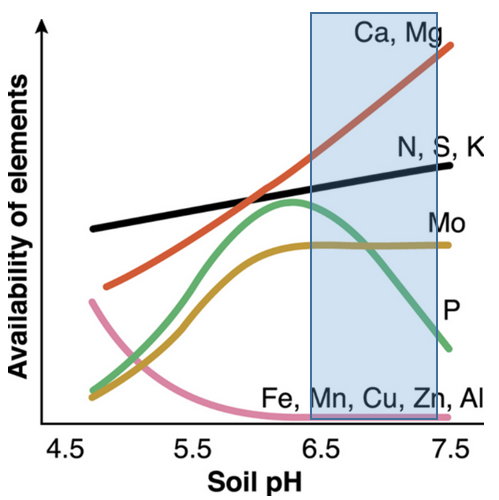
Fig. 2. Nutrient availability with soil pH below 'ideal' (blue rectangle). Source: Government of Western Australia, Department of Agriculture and Food
Conditions contributing to low soil pH
- Ammonium-based N fertilization (e.g., urea, Figure 3). Nitrification is ammonium + air → nitrate + water + acid (H+). When roots take up nitrate (NO3-), they either give off OH- and HCO3- or take up K+, Na+, Ca2+ and Mg2+ to maintain plant’s charge balance. If nitrate isn’t taken up where nitrification happened (generally within inches of where fertilizer is applied), then the soil where nitrification happened becomes acidic.
-
No-till concentrates acidity in the top 3" when N fertilizer is broadcast, and top 5” when N is banded at 2 to 4” depth. However, even with 9" moldboard plowing, N fertilizer at rates above plant uptake caused soil acidification in the 0 to 9" soil layer (Rasmussen & Rohde 1989).
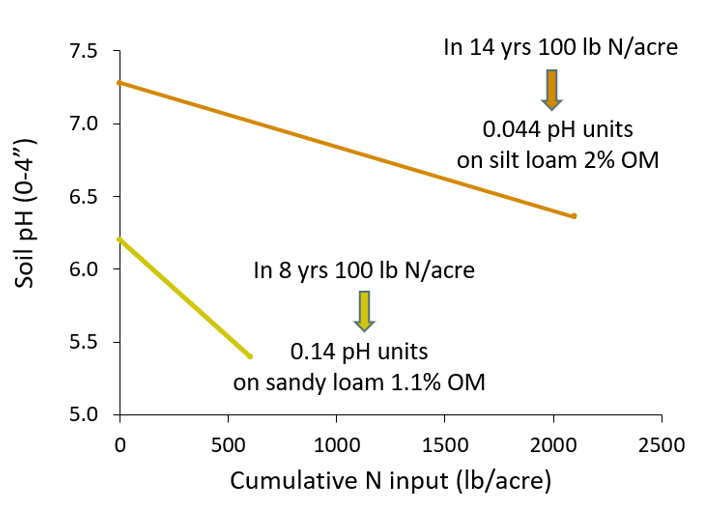
Fig. 3. Soil pH decline with cumulative N fertilizer input at two Montana locations (Engel, Ewing, Miller, Jones unpub. data).
- Soils with high sand content and/or low levels of soil organic matter (SOM)
- Crop residue removal of Ca, Mg, K ('base' cations). For example, to counteract loss of bases, oat straw removal requires 6 times the lime as oat grain harvest (Pierre & Banwart 1973).
- Leaching. Nitrate from fertilizer nitrification that is not taken up by plants but lost to leaching leaves H+ in the soil.
- Legumes acidify their root-zone through N-fixation. Perennial legumes (e.g., alfalfa) more so than annuals (e.g., pea). This appears to be far less of an issue than N-fertilization.
Soil Testing
Soil testing to establish WHERE soil pH is low in a field is more critical than calculating an exact lime rate. To determine whether soil pH is the cause of poor plant growth, sample at the 2” and 4” depth with a field pH meter or the 0 to 3” depth through a lab. Because low pH tends to be found in the narrow depth where fertilizer N is applied, or slightly below that, sampling over a 6 or 12” depth could seriously overestimate soil pH in the critical seeding zone (0 to 3” depth, Reeves & Liebig 2016). See our Soil Sampling website for field testing instructions. Digital meters are less objective than 'color' kits. They can indicate whether acidity may be an issue and help select which soils to field or lab test for lime rate calculations (see Fertilizer eFact 80 and Soil Acidification: Management).
Soil samples for lime rate calculations should be at least ¾” diameter and 6” deep (or average the 0 to 3” and 3 to 6” results). For a lab sample, mix a composite of 6 to 10 subsamples and submit about a 2-fist size sample to the lab. Remove plant residue or duff on the soil surface before taking the soil sample core. Samples should be kept cold or frozen until delivered.
An alternative pH test is the modified Mehlich buffer test, which is suitable for Montana soils and used in combination with specific published liming rate tables (Engel 2020, Buffer pH to Derive Lime Guidelines). However, lime rates based on the buffer test are not field tested in Montana, while the rate calculations presented in Fertilizer eFact 80 and Soil Acidification: Managementare based on Montana field trials.
Consistently use the same pH meter or buffer test to ensure comparable data over time. Soil testing labs usually note test methods used on the soil test report. Also, pH varies seasonally, so annual comparisons should be made from samples taken the same time of year.
For more information
MSU Extension Soil Fertility Cropland Soil Acidification webpage
http://landresources.montana.edu/soilfertility/acidif/index.html
MSU Fertilizer eFacts No. 78, 79, 80
Soil Acidification: Management http://landresources.montana.edu/soilfertility/soilscoop.html
Soil pH and Organic Matter, Nutrient Management Module No. 8. http://landresources.montana.edu/nm/index.html
Buffer pH to Derive Lime Guidelines. Cornell University Cooperative Extension Agronomy Fact Sheet 48 http://nmsp.cals.cornell.edu/publications/factsheets/factsheet48.pdf
References
Engel, R. 2020. Soil acidity management of long-term no-till fields in Montana to prevent crop failure. WSARE final report SW17-016.
Pierre, W., and W. Banwart. 1973. Excess-base and excess-base/nitrogen ratio of various crop species and part of plants. Agron. J. 65:91-96. doi:10.2134/agronj1973.00021962006500010028x
Rasmussen, P.E., and C.R. Rohde. 1989. Soil acidification from ammonium-nitrogen fertilization in moldboard plow
and stubble-mulch wheat-fallow tillage. Soil Science Society of America Journal. 53:119-122. doi:10.2136/sssaj1989.03615995005300010001x
Reeves, J.L., and M.A. Liebig. 2016. Depth matters: Soil pH and dilution effects in the northern Great Plains. Soil Science
Society of America Journal. 80:1424–1427. doi:10.2136/sssaj2016.02.0036n